- Google Cloud
- Cloud Forums
- Apigee
- How to browse proxies logs (including bodies, head...
- Subscribe to RSS Feed
- Mark Topic as New
- Mark Topic as Read
- Float this Topic for Current User
- Bookmark
- Subscribe
- Mute
- Printer Friendly Page
- Mark as New
- Bookmark
- Subscribe
- Mute
- Subscribe to RSS Feed
- Permalink
- Report Inappropriate Content
- Mark as New
- Bookmark
- Subscribe
- Mute
- Subscribe to RSS Feed
- Permalink
- Report Inappropriate Content
Hi,
Background:
- Apigee SaaS (managed by Apigee in GCP)
- Suscribed level: Enterprise
Needs:
Quite surprised by not having this feature by default into Apigee or even info relating to this topic since it is so classical in APIm concerns.
So I need to have the proxies logs (90 days with enterprise level), with all the necessary information, such as request and response body, header and other cutom variables, to understand potential issues.
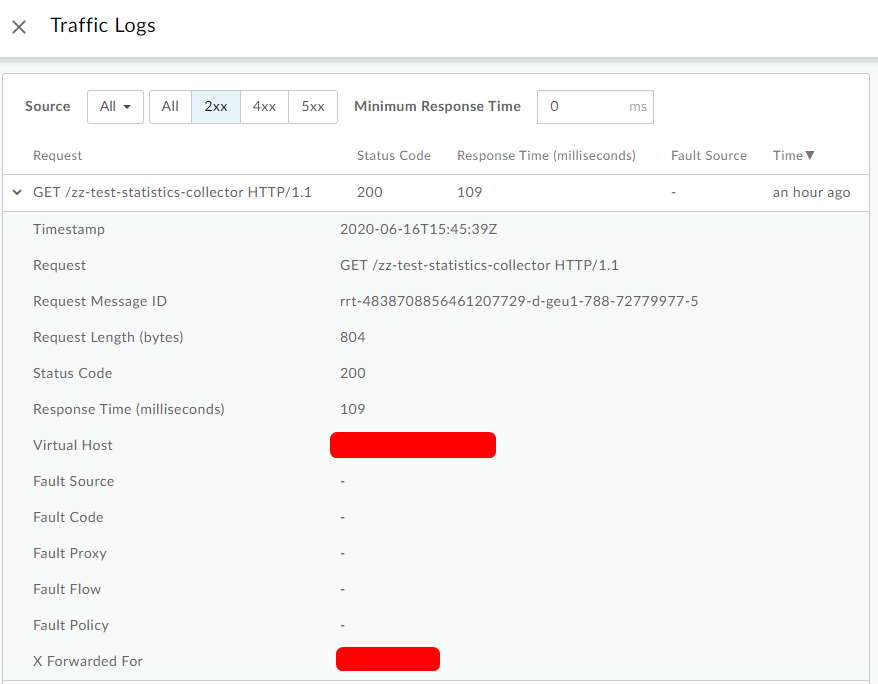
By default, in the "Investigate" section in "API Monitoring" only a few irrelevant information appears, even in this case with a proxy having the StatisticsCollector policy to gather data from query parameters, request headers, request and response bodies...
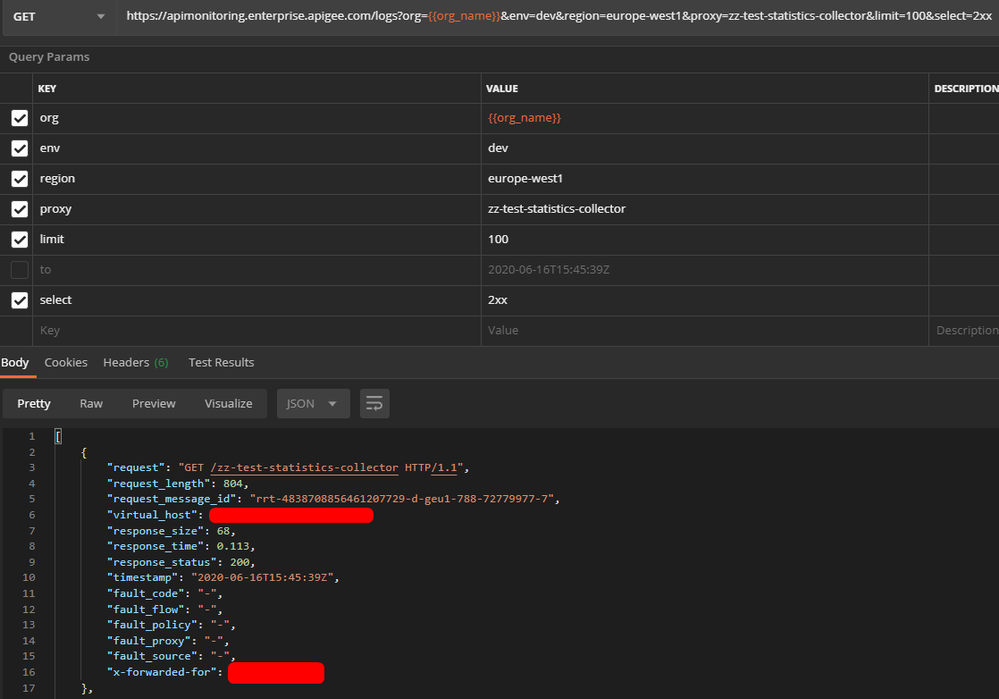
No more info using the API
So the question is how to access logs with relevant data such as query parameters, request headers, request and response bodies, ... ?
This sounds like a basic feature regarding an API management platform.
Regards.
- Labels:
-
Analytics
- Mark as New
- Bookmark
- Subscribe
- Mute
- Subscribe to RSS Feed
- Permalink
- Report Inappropriate Content
- Mark as New
- Bookmark
- Subscribe
- Mute
- Subscribe to RSS Feed
- Permalink
- Report Inappropriate Content
You have to log what you want.
Apigee itself does not include a 90-day log retention capability, storing full payloads, headers, URLs, and other data.
Apigee automatically collects data for analytics purposes. This includes URLs, verbs, timestamps, status code, response time, and API-related metadata like API Proxy, API Product, Developer name, and so on. Apigee uses that data to satisfy stats queries, administrative calls to the /stats API. This API also powers the interactive analytics charts.
It is possible for you to extend the basic data that Apigee collects with each API call via the StatisticsCollector policy. That has been covered a number of times in different Q&A and articles here on the community site. Also you can check the formal documentation site for information on "custom analytics".
Most customers who want full logging of payloads and other data will modify their API proxies (or use the FlowHook capability) to explicitly send logs to something like Google Cloud Logging or Splunk.
- Mark as New
- Bookmark
- Subscribe
- Mute
- Subscribe to RSS Feed
- Permalink
- Report Inappropriate Content
- Mark as New
- Bookmark
- Subscribe
- Mute
- Subscribe to RSS Feed
- Permalink
- Report Inappropriate Content
Thanks Dino for the response,
But the point is even in this case with a proxy having the StatisticsCollector policy to gather data from query parameters, request headers, request and response bodies... I am not able to see anything into the UI or via API as shown in the screenshots.
Is that a bug ?
- Mark as New
- Bookmark
- Subscribe
- Mute
- Subscribe to RSS Feed
- Permalink
- Report Inappropriate Content
- Mark as New
- Bookmark
- Subscribe
- Mute
- Subscribe to RSS Feed
- Permalink
- Report Inappropriate Content
It's by design - the StatisticsCollector is designed to support custom analytics. It's not designed to support the user story you described: "I want to be able to view specific past requests handled by Apigee, including URLs, headers, payloads, etc"
Explicitly sending data from the proxy to something like Google Cloud Logging or Splunk would support that specific user story.
- Mark as New
- Bookmark
- Subscribe
- Mute
- Subscribe to RSS Feed
- Permalink
- Report Inappropriate Content
- Mark as New
- Bookmark
- Subscribe
- Mute
- Subscribe to RSS Feed
- Permalink
- Report Inappropriate Content
Ok got it, but what about "I want to investigate errors (that occurs in the past) having full messages (request and response) to understand what could be the cause." sounds like a basic need right ?
-
Analytics
497 -
API Hub
75 -
API Runtime
11,663 -
API Security
175 -
Apigee General
3,028 -
Apigee X
1,272 -
Developer Portal
1,906 -
Drupal Portal
43 -
Hybrid
461 -
Integrated Developer Portal
87 -
Integration
309 -
PAYG
13 -
Private Cloud Deployment
1,067 -
User Interface
75
| User | Count |
|---|---|
| 2 | |
| 1 | |
| 1 | |
| 1 | |
| 1 |

 Twitter
