- Google Cloud
- Cloud Forums
- Apigee
- Log numbers don't add up
- Subscribe to RSS Feed
- Mark Topic as New
- Mark Topic as Read
- Float this Topic for Current User
- Bookmark
- Subscribe
- Mute
- Printer Friendly Page
- Mark as New
- Bookmark
- Subscribe
- Mute
- Subscribe to RSS Feed
- Permalink
- Report Inappropriate Content
- Mark as New
- Bookmark
- Subscribe
- Mute
- Subscribe to RSS Feed
- Permalink
- Report Inappropriate Content
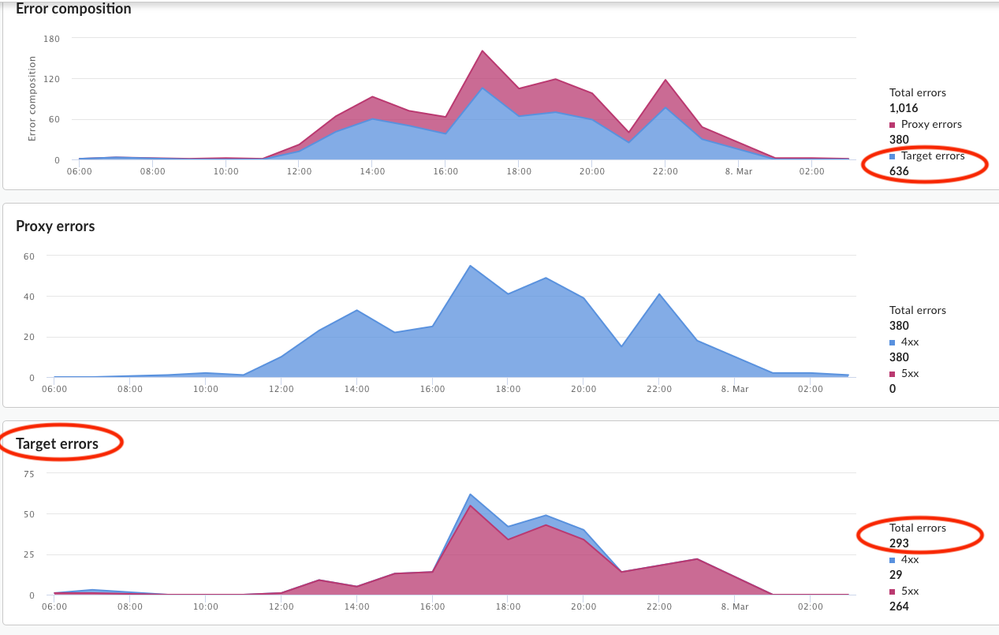
As you can see in this screenshot the Error Code Analysis page is showing there were 1016 total errors during this time, and 636 were target errors. But on the Target errors chart it says the total error were 293. What happened to the 343 errors that were target errors but aren't on the target errors chart?
- Labels:
-
Analytics
- Mark as New
- Bookmark
- Subscribe
- Mute
- Subscribe to RSS Feed
- Permalink
- Report Inappropriate Content
- Mark as New
- Bookmark
- Subscribe
- Mute
- Subscribe to RSS Feed
- Permalink
- Report Inappropriate Content
So looks like, not all target errors have a response code associated to them... i.e. if the target becomes un-reachable or ssl negotiation fails
- Mark as New
- Bookmark
- Subscribe
- Mute
- Subscribe to RSS Feed
- Permalink
- Report Inappropriate Content
- Mark as New
- Bookmark
- Subscribe
- Mute
- Subscribe to RSS Feed
- Permalink
- Report Inappropriate Content
Right, so ... of the 636 "target errors" shown in the first chart, some portion of them could be due to TLS negotiation failures, and some could be successful connection, resulting in an unsuccessful HTTP response (4xx, 5xx). The third chart shows only the unsuccessful HTTP response.
Is it possible TLS is not configured properly?
If the Apigee side is misconfigured then we would expect see consistent TLS negotiation failures. I suppose if the backend (upstream) has multiple TLS termination points, and one of those is misconfigured, then... you would expect to see inconsistent behavior: some failures and some successful connections.
Has the TLS configuration been changing during that period? Is it possible that the config during 8 march was changed either on the backend or on the Apigee side?
- Mark as New
- Bookmark
- Subscribe
- Mute
- Subscribe to RSS Feed
- Permalink
- Report Inappropriate Content
- Mark as New
- Bookmark
- Subscribe
- Mute
- Subscribe to RSS Feed
- Permalink
- Report Inappropriate Content
We were having a bunch of problems at that time. Timeouts being the mostly likely, no reconfiguration of TLS as far as I'm aware. I'm prepared to accept that a no-response from the server is the cause of the lack of numbers, it would be nice if Apigee could show the count for 'unset' like they on other charts.
- Mark as New
- Bookmark
- Subscribe
- Mute
- Subscribe to RSS Feed
- Permalink
- Report Inappropriate Content
- Mark as New
- Bookmark
- Subscribe
- Mute
- Subscribe to RSS Feed
- Permalink
- Report Inappropriate Content
Targets sometimes connect and start responding, before the full response is read it closes the connection then the connection is successful but the response code is error. This is the difference indicate to.
-
Analytics
497 -
API Hub
75 -
API Runtime
11,662 -
API Security
175 -
Apigee General
3,027 -
Apigee X
1,270 -
Developer Portal
1,906 -
Drupal Portal
43 -
Hybrid
459 -
Integrated Developer Portal
87 -
Integration
308 -
PAYG
13 -
Private Cloud Deployment
1,067 -
User Interface
75
| User | Count |
|---|---|
| 2 | |
| 1 | |
| 1 | |
| 1 | |
| 1 |

 Twitter