- Google Cloud
- Cloud Forums
- Apigee
- View usage information per Developers
- Subscribe to RSS Feed
- Mark Topic as New
- Mark Topic as Read
- Float this Topic for Current User
- Bookmark
- Subscribe
- Mute
- Printer Friendly Page
- Mark as New
- Bookmark
- Subscribe
- Mute
- Subscribe to RSS Feed
- Permalink
- Report Inappropriate Content
- Mark as New
- Bookmark
- Subscribe
- Mute
- Subscribe to RSS Feed
- Permalink
- Report Inappropriate Content
Hi there,
In developer portal, using the Apigee SDK for Drupal, each Developer (user of developer.tomtom.com) can see in the Analytics section for his app this information: Throughput, Max Response Time, Min Response Time, Endpoint Response Time, Message Count, Error Count.
Account Managers (responsible for the Developers) want to have access to this information too.
Is there a way I can provide access to this information to Account Manager in Apigee UI? I thought about a customer report, but I don't know which information I should select for Metrics. Can you please help?
- Labels:
-
Analytics
- Mark as New
- Bookmark
- Subscribe
- Mute
- Subscribe to RSS Feed
- Permalink
- Report Inappropriate Content
- Mark as New
- Bookmark
- Subscribe
- Mute
- Subscribe to RSS Feed
- Permalink
- Report Inappropriate Content
@Emilia Ipate , Great Question,
Yes, It's possible to see the analytics in Edge UI as "Account Managers". You can create a new custom role in Edge UI called "Account Managers" and give access to view custom reports.
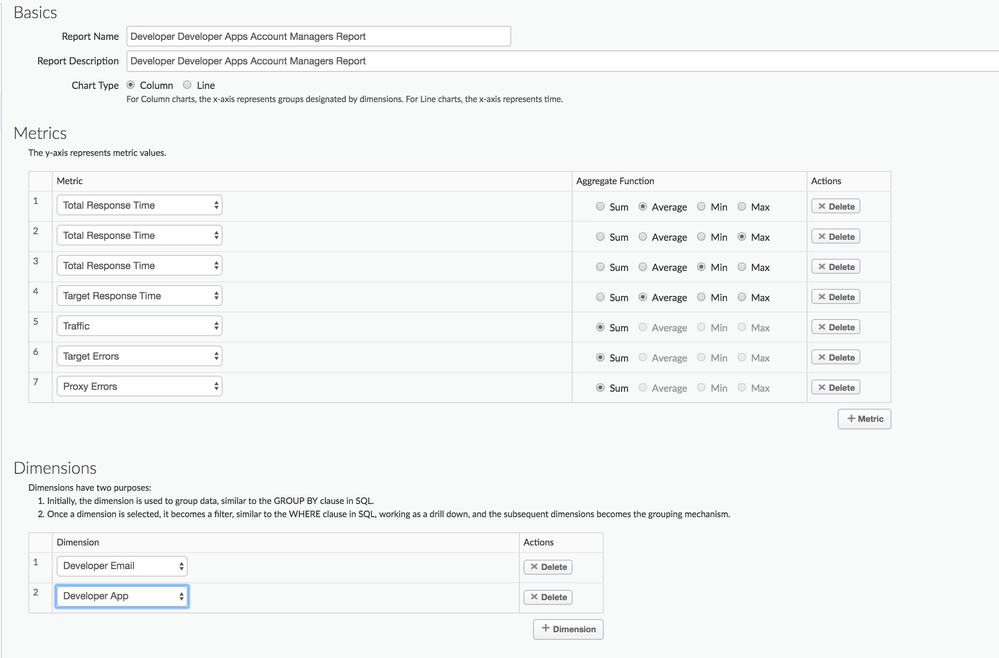
Actually, Developer Portal pulls this information from Apigee Edge Analytics using API. Yes, You need to create a custom report in Edge UI to see this information.
Mapping of metrics -> Display name in developer portal ,
'total_response_time' => t('Total Response Time'),
'max_response_time' => t('Max Response Time'),
'min_response_time' => t('Min Response Time'),
'end_point_response_time' => t('Endpoint Response Time'),
'message_count' => t('Traffic'),
'error_count' => t('Errors'),
For Example, See screenshot below that shows how to create a custom report using different metrics same as one displayed in developer portal by developer & developer app.
You can find more about different metrics in Apigee Docs here.
Hope it helps. Understand it's a delayed answer & believe it will also help others. Keep us posted if any.
@spadmanabhan , Why some metrics are missing in custom reports create page ? I see many metrics in docs page here ? Any idea ?
- Mark as New
- Bookmark
- Subscribe
- Mute
- Subscribe to RSS Feed
- Permalink
- Report Inappropriate Content
- Mark as New
- Bookmark
- Subscribe
- Mute
- Subscribe to RSS Feed
- Permalink
- Report Inappropriate Content
@Anil Sagar can you please indicate that is the mapping metric for "Throughput"? In developer portal a user sees throughput as a selectable option (next to Min Response Time, Max Response Time, Message count, Error Count). Your answer above does not include the explanation about Throughput.
-
Analytics
497 -
API Hub
75 -
API Runtime
11,663 -
API Security
175 -
Apigee General
3,028 -
Apigee X
1,272 -
Developer Portal
1,906 -
Drupal Portal
43 -
Hybrid
460 -
Integrated Developer Portal
87 -
Integration
309 -
PAYG
13 -
Private Cloud Deployment
1,067 -
User Interface
75
| User | Count |
|---|---|
| 2 | |
| 1 | |
| 1 | |
| 1 | |
| 1 |

 Twitter
