- Google Cloud
- Cloud Forums
- Apigee
- Analytics per Proxy Endpoint
- Subscribe to RSS Feed
- Mark Topic as New
- Mark Topic as Read
- Float this Topic for Current User
- Bookmark
- Subscribe
- Mute
- Printer Friendly Page
- Mark as New
- Bookmark
- Subscribe
- Mute
- Subscribe to RSS Feed
- Permalink
- Report Inappropriate Content
- Mark as New
- Bookmark
- Subscribe
- Mute
- Subscribe to RSS Feed
- Permalink
- Report Inappropriate Content
Hi,
I've noticed that we can see analytics per api proxy, but I don't see a way to filter down these results to just certain endpoints. This is really critical for us, as we have proxies with up to 10+ endpoints, and need analytics for each one.
Thanks,
Aleks
- Labels:
-
API Runtime
- Mark as New
- Bookmark
- Subscribe
- Mute
- Subscribe to RSS Feed
- Permalink
- Report Inappropriate Content
- Mark as New
- Bookmark
- Subscribe
- Mute
- Subscribe to RSS Feed
- Permalink
- Report Inappropriate Content
HI @aleks1 - when you say 10+ end points, are you referring to 10 flows (resources) in your proxy ? And you want reports on them ?
- Mark as New
- Bookmark
- Subscribe
- Mute
- Subscribe to RSS Feed
- Permalink
- Report Inappropriate Content
- Mark as New
- Bookmark
- Subscribe
- Mute
- Subscribe to RSS Feed
- Permalink
- Report Inappropriate Content
10 different flows. As in, ten different paths (/inventory/quantity, /orders/status, /salesorders, etc.) with their own flow that converge to a single target endpoint.
- Mark as New
- Bookmark
- Subscribe
- Mute
- Subscribe to RSS Feed
- Permalink
- Report Inappropriate Content
- Mark as New
- Bookmark
- Subscribe
- Mute
- Subscribe to RSS Feed
- Permalink
- Report Inappropriate Content
HI @aleks1
In Custom Report, there is a dimension for Proxy Path Suffix you can select that will give you the stats for each calls that were made to those resources
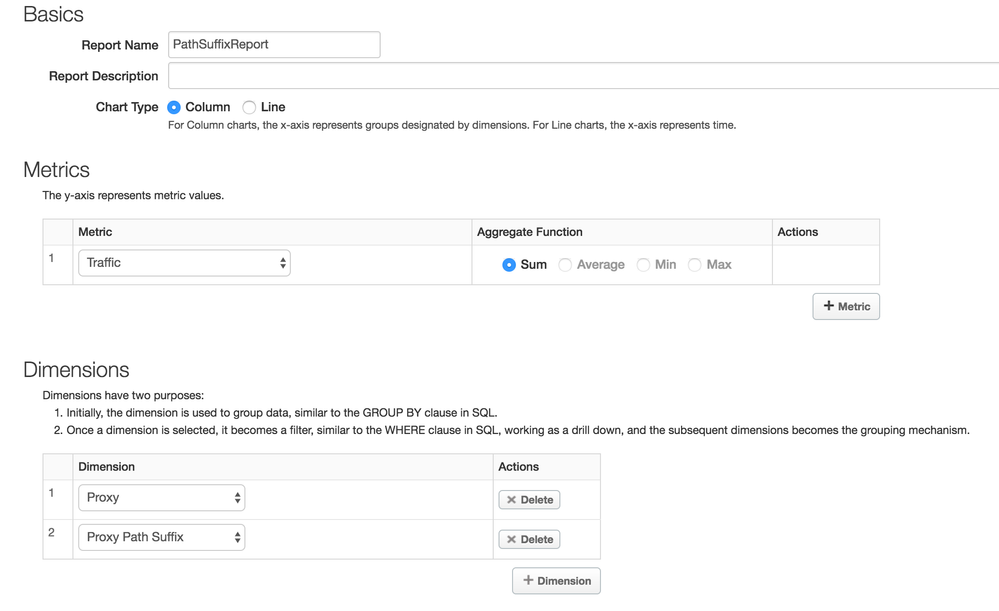
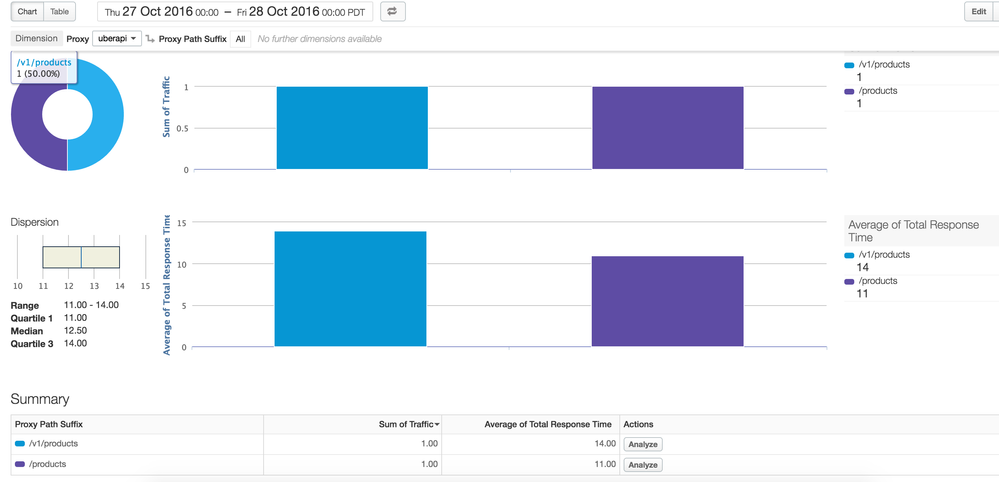
You can create a Custom report with Proxy as the first dimension and Proxy Path Suffix as the second dimension. Save the report
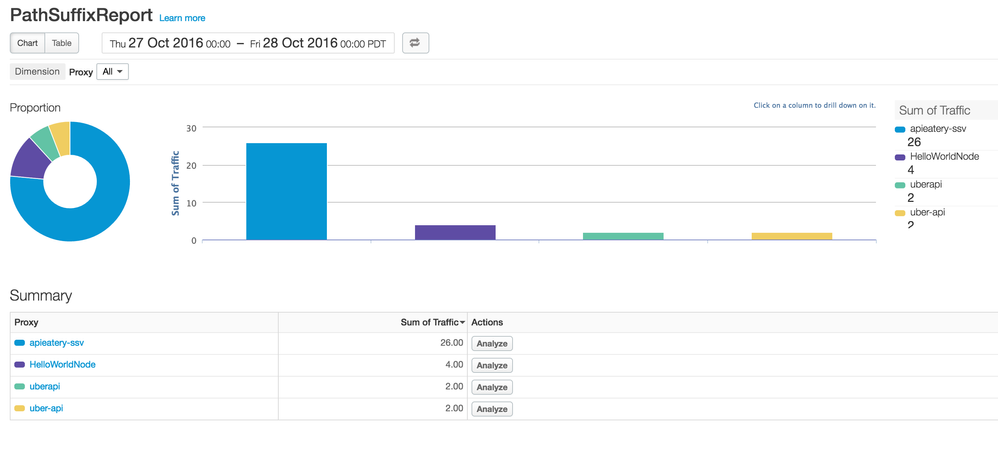
On a given time range, the report should show traffic info across proxies which is the first dimension.
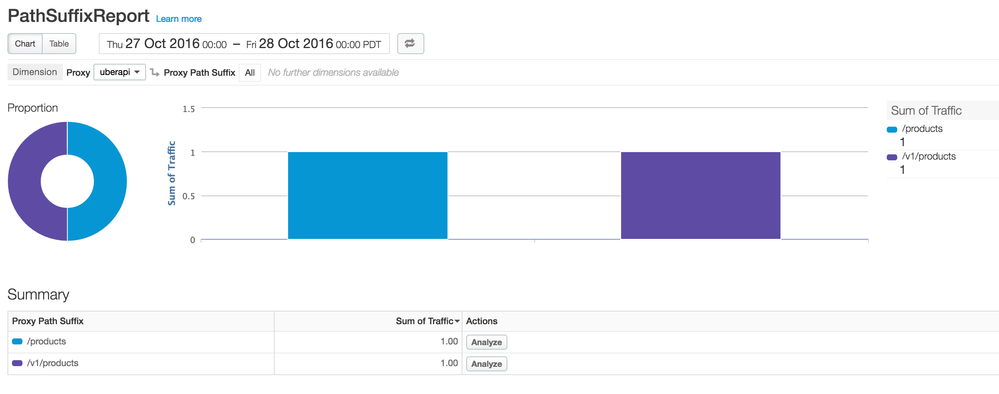
On clicking the proxy (in my case, I clicked the uberapi proxy), you should be able to drill down to another graph that shows the report per path suffix within that proxy
Hope this helps. Let me know if you have any other questions.
- Mark as New
- Bookmark
- Subscribe
- Mute
- Subscribe to RSS Feed
- Permalink
- Report Inappropriate Content
- Mark as New
- Bookmark
- Subscribe
- Mute
- Subscribe to RSS Feed
- Permalink
- Report Inappropriate Content
You can create a report with just Proxy Path Suffix as One dimension, but with the way I mentioned, its more easier to get the values for each proxies. Otherwise you would see across all which could make the report confusing
- Mark as New
- Bookmark
- Subscribe
- Mute
- Subscribe to RSS Feed
- Permalink
- Report Inappropriate Content
- Mark as New
- Bookmark
- Subscribe
- Mute
- Subscribe to RSS Feed
- Permalink
- Report Inappropriate Content
Hello, tried your way, but how can I see the response time per call for a specific path?
- Mark as New
- Bookmark
- Subscribe
- Mute
- Subscribe to RSS Feed
- Permalink
- Report Inappropriate Content
- Mark as New
- Bookmark
- Subscribe
- Mute
- Subscribe to RSS Feed
- Permalink
- Report Inappropriate Content
HI @ali1
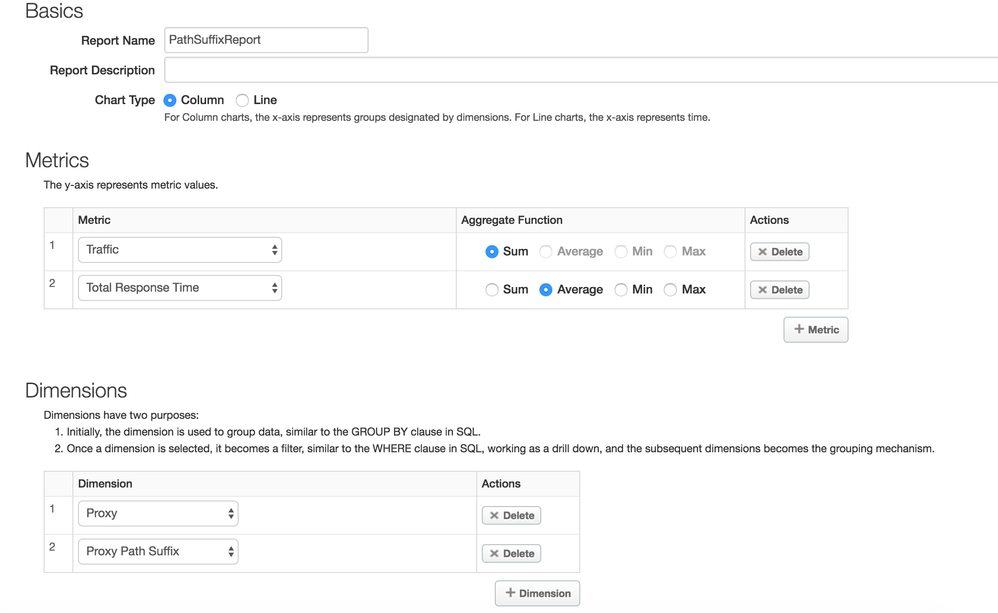
That can be done by adding another Metrics "Total Response Time".
You should be able to see both the metrics in the same report
The graph on the top gives the traffic count for each base path and the one below has the response time (average).
Hope this helps
- Mark as New
- Bookmark
- Subscribe
- Mute
- Subscribe to RSS Feed
- Permalink
- Report Inappropriate Content
- Mark as New
- Bookmark
- Subscribe
- Mute
- Subscribe to RSS Feed
- Permalink
- Report Inappropriate Content
- Mark as New
- Bookmark
- Subscribe
- Mute
- Subscribe to RSS Feed
- Permalink
- Report Inappropriate Content
- Mark as New
- Bookmark
- Subscribe
- Mute
- Subscribe to RSS Feed
- Permalink
- Report Inappropriate Content
Your suggestion are working. But I was trying to do open period like get an aggregate results for 3 months. The report does not allow me more than 15 days period. is the a way to have free date/time range?
- Mark as New
- Bookmark
- Subscribe
- Mute
- Subscribe to RSS Feed
- Permalink
- Report Inappropriate Content
- Mark as New
- Bookmark
- Subscribe
- Mute
- Subscribe to RSS Feed
- Permalink
- Report Inappropriate Content
HI @ali1
For that you might need to use the Management Stats API. I just ran this curl command to get the JSON response. You can use this and convert to a report
curl -X GET --header "Authorization:Basic *****" "https://api.enterprise.apigee.com/v1/o/{org}/e/{env}/stats/proxy_pathsuffix?select=sum(message_count)&timeRange=10%2F01%2F2016%2000%3A00~10%2F30%2F2016%2023%3A59&timeUnit=week"<br>You can provide your own time range you want. I have provided 10/01/2016 to 10/30/2016
More info here
- Mark as New
- Bookmark
- Subscribe
- Mute
- Subscribe to RSS Feed
- Permalink
- Report Inappropriate Content
- Mark as New
- Bookmark
- Subscribe
- Mute
- Subscribe to RSS Feed
- Permalink
- Report Inappropriate Content
That works but not when we have proxy suffixes with dynamically determined parameter. If I have a /path/{dynamically_determined_parameter} as the path suffix, it will treat each endpoint as a unique path. Is there any suggested ways to do this?
-
Analytics
497 -
API Hub
75 -
API Runtime
11,663 -
API Security
175 -
Apigee General
3,028 -
Apigee X
1,272 -
Developer Portal
1,906 -
Drupal Portal
43 -
Hybrid
461 -
Integrated Developer Portal
87 -
Integration
309 -
PAYG
13 -
Private Cloud Deployment
1,067 -
User Interface
75
| User | Count |
|---|---|
| 2 | |
| 1 | |
| 1 | |
| 1 | |
| 1 |

 Twitter