- Google Cloud
- Cloud Forums
- Apigee
- Is there a way to create a custom error report htt...
- Subscribe to RSS Feed
- Mark Topic as New
- Mark Topic as Read
- Float this Topic for Current User
- Bookmark
- Subscribe
- Mute
- Printer Friendly Page
- Mark as New
- Bookmark
- Subscribe
- Mute
- Subscribe to RSS Feed
- Permalink
- Report Inappropriate Content
- Mark as New
- Bookmark
- Subscribe
- Mute
- Subscribe to RSS Feed
- Permalink
- Report Inappropriate Content
I have an API proxy and I have added some Quota policy to it. I have already added Fault handling to generate custom message (eg: for a Concurrent Rate Limit system generates 503 Service Unavailable, and I assign a custom message for response). Is there a way to create a custom report that can get all HTTP error codes from selected/all proxies and generate a report for that?
Solved! Go to Solution.
- Mark as New
- Bookmark
- Subscribe
- Mute
- Subscribe to RSS Feed
- Permalink
- Report Inappropriate Content
- Mark as New
- Bookmark
- Subscribe
- Mute
- Subscribe to RSS Feed
- Permalink
- Report Inappropriate Content
Hi @TariqGhalib
You can get the general error info from Analytics --> Error Analysis. This gives you different metrics (by proxy, target, response codes).
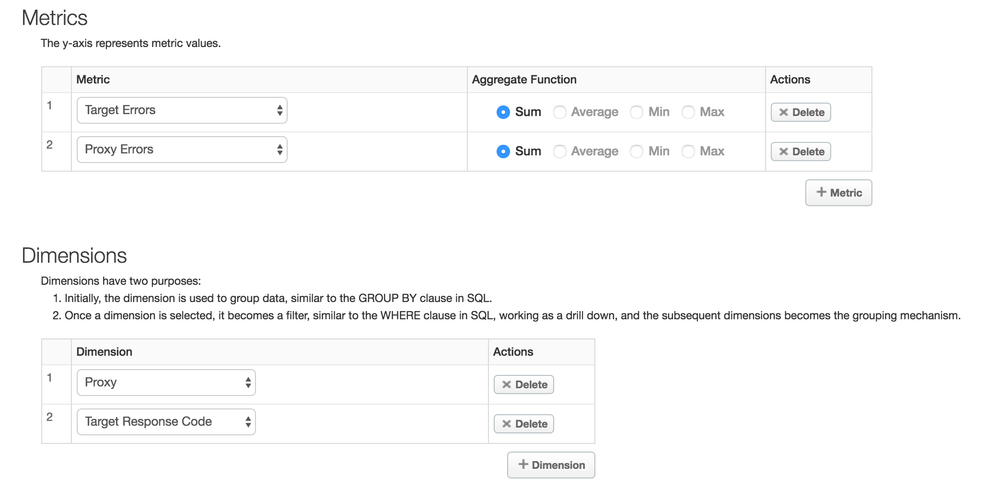
If you want a Custom Report, you can go to Analytics --> Reports. Click +New Report button.
See screenshot below:
Under Metrics, you can select Target Errors or Proxy errors (or both by clicking +Metric button).
Under Dimensions, you can select Proxy and one more for Target Response Code.
You can also filter to certain proxies, error codes, etc by adding conditions under the Filter section.
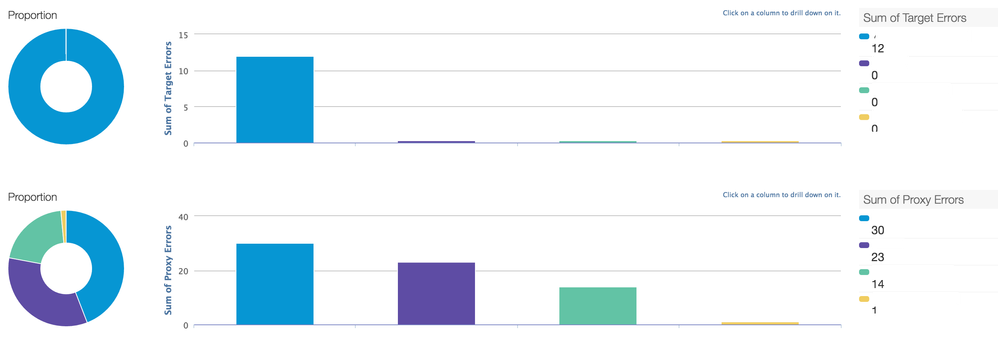
Once this is saved, you should be able to see the report by selecting a time range.
In the graph,by clicking the proxy, you will see the analysis for the error codes for that proxy
Hope this help. Please reach out if you need more info
- Mark as New
- Bookmark
- Subscribe
- Mute
- Subscribe to RSS Feed
- Permalink
- Report Inappropriate Content
- Mark as New
- Bookmark
- Subscribe
- Mute
- Subscribe to RSS Feed
- Permalink
- Report Inappropriate Content
Thanks Sai,
In addition to above we are also looking into exploring the "Analyze API message using custom analytics". One thing that I am trying to understand is the statistics collector policy. Can you elaborate two things:
- Extracting variables policy (watched the yahoo weather demo but since yahoo weather api is not available now, its hard to understand without practicing it). We have been experimenting with the Hotels Api. I tried to extract uuid from the GET response of "Find all hotels" and inject it in the GET request for "Get hotel by uuid" but I couldn't make it work.
- Then how do use the extracted variable to use the Statistics Collector policy to write data to the Analytics Service
- Mark as New
- Bookmark
- Subscribe
- Mute
- Subscribe to RSS Feed
- Permalink
- Report Inappropriate Content
- Mark as New
- Bookmark
- Subscribe
- Mute
- Subscribe to RSS Feed
- Permalink
- Report Inappropriate Content
Hi @TariqGhalib
Believe you got the answer here
If you need more help, please reach out. If your query is resolved, Please accept this answer so that others can refer this later.
- Mark as New
- Bookmark
- Subscribe
- Mute
- Subscribe to RSS Feed
- Permalink
- Report Inappropriate Content
- Mark as New
- Bookmark
- Subscribe
- Mute
- Subscribe to RSS Feed
- Permalink
- Report Inappropriate Content
I have tried the Dev Jam lab4 but after adding the 2 policies (Extract Variables & Statistics Collector) when I try it for the first UUID it returns required response and 200 ok. I am still not able to see this:
You will see devjam_{your_initials}__city, as a dimension in a custom report, whereas devjam_{your_initials}_rating as a metric
anywhere when I go ahead and create a custom report
- Mark as New
- Bookmark
- Subscribe
- Mute
- Subscribe to RSS Feed
- Permalink
- Report Inappropriate Content
- Mark as New
- Bookmark
- Subscribe
- Mute
- Subscribe to RSS Feed
- Permalink
- Report Inappropriate Content
Hi
Can you share the proxy bundle so that I can take a look at it ?
- Mark as New
- Bookmark
- Subscribe
- Mute
- Subscribe to RSS Feed
- Permalink
- Report Inappropriate Content
- Mark as New
- Bookmark
- Subscribe
- Mute
- Subscribe to RSS Feed
- Permalink
- Report Inappropriate Content
Sure, Please see attached bundlepcc-demo-apigee.zip
- Mark as New
- Bookmark
- Subscribe
- Mute
- Subscribe to RSS Feed
- Permalink
- Report Inappropriate Content
- Mark as New
- Bookmark
- Subscribe
- Mute
- Subscribe to RSS Feed
- Permalink
- Report Inappropriate Content
I have figured out the issue. I was not adding the policies in the right location. One issue is still there and that is:
The extracted variable collected by statistics collector is not showing right away under the custom reports Dimensions and/or Metrics. Is there a cron job or a sync job that needs to be run before the new custom dimensions or metrics start showing in the custom reports drop down selections?
- Mark as New
- Bookmark
- Subscribe
- Mute
- Subscribe to RSS Feed
- Permalink
- Report Inappropriate Content
- Mark as New
- Bookmark
- Subscribe
- Mute
- Subscribe to RSS Feed
- Permalink
- Report Inappropriate Content
HI @TariqGhalib
As @spadmanabhan mentioned here, its been disabled temporarily for trial orgs.
-
Analytics
497 -
API Hub
75 -
API Runtime
11,660 -
API Security
174 -
Apigee General
3,020 -
Apigee X
1,263 -
Developer Portal
1,906 -
Drupal Portal
43 -
Hybrid
459 -
Integrated Developer Portal
87 -
Integration
308 -
PAYG
13 -
Private Cloud Deployment
1,067 -
User Interface
75
| User | Count |
|---|---|
| 3 | |
| 2 | |
| 1 | |
| 1 | |
| 1 |

 Twitter
