- Google Cloud Security
- Google Security Operations
- Google Security Operations Forums
- SIEM Forum
- Re: assistance in YARA rule
- Subscribe to RSS Feed
- Mark Topic as New
- Mark Topic as Read
- Float this Topic for Current User
- Bookmark
- Subscribe
- Mute
- Printer Friendly Page
- Mark as New
- Bookmark
- Subscribe
- Mute
- Subscribe to RSS Feed
- Permalink
- Report Inappropriate Content
- Mark as New
- Bookmark
- Subscribe
- Mute
- Subscribe to RSS Feed
- Permalink
- Report Inappropriate Content
Hi
I need to migrate the below Splunk alert to Chronicle , can some one assist how this can be converted in YARA-L
search (index=wineventlog )source="WinEventLog:Microsoft-Windows-Windows Defender/Operational" OR (index=azure_ad_connect sourcetype="azure:loganalytics:ad:ProtectionStatus")
| rename dvc as src
| stats max(_time) as lastEvent by src index
| eval age=now()-lastEvent
| where age>14400
Solved! Go to Solution.
- Mark as New
- Bookmark
- Subscribe
- Mute
- Subscribe to RSS Feed
- Permalink
- Report Inappropriate Content
- Mark as New
- Bookmark
- Subscribe
- Mute
- Subscribe to RSS Feed
- Permalink
- Report Inappropriate Content
Ill leave the "search" line for you to map your Splunk index to chronicle UDM fields. Starting from Line 3: you can do something like this:
event:
// base search
// make sure you assign your variable
// lets assume that variables are $hostname, $vendor
match:
  $hostname, $vendor over 24h
outcome:
  $last_event timestamp.current_seconds() - max($e.metadata.ingested_timestamp.seconds)
condition:
  $e and $last_event > 14400 //4 hours

Issues with this is that all the events that contributed to this will be present in the alerts. But you could user do the outcome line in the "event" step to also reduce the number of events.
18000 <= timestamp.current_seconds() - $e.metadata.ingested_timestamp.seconds // this will return any event ingested within the last 5 hours
I would not recommend doing this search on a log type that is loud.- Mark as New
- Bookmark
- Subscribe
- Mute
- Subscribe to RSS Feed
- Permalink
- Report Inappropriate Content
- Mark as New
- Bookmark
- Subscribe
- Mute
- Subscribe to RSS Feed
- Permalink
- Report Inappropriate Content
Couple of thoughts here:
We need to flip the greater than sign because we want the difference between now and the ingest to be more than some timeframe.
I know this is a stub rule and there are more things specific to the environment to add, but I added a net function to focus on a specific IP range to help pull this back otherwise it gets super busy.
The log type field versus product name might be a good choice to use if you are matching since multiple product values could use the same log type.
  events:
    $e.metadata.product_name = $product_name
    $e.principal.hostname = $hostname
    net.ip_in_range_cidr($e.principal.ip, "10.0.0.0/8")
    14400 < math.abs(timestamp.current_seconds() - ($e.metadata.ingested_timestamp.seconds))

    match:
    $hostname, $product_name over 24h
Because the rules engine is currently designed for a 48 hour window, it needs to have something to compare something to. So looking for matches in a 24 hour window and saying that the time boundary we are monitoring for is also 24 hours is not going to be where we want to be. We could say look over the past 24 hours for events and then tell me which events we have not ingested in the past 4 hours, which is what I have above. It still may be a bit noisy but get you going.
We are continuing to evolve the platform and later this year we may have some additional methods to do this over broader time windows as well... Hope this helps.
- Mark as New
- Bookmark
- Subscribe
- Mute
- Subscribe to RSS Feed
- Permalink
- Report Inappropriate Content
- Mark as New
- Bookmark
- Subscribe
- Mute
- Subscribe to RSS Feed
- Permalink
- Report Inappropriate Content
Ill leave the "search" line for you to map your Splunk index to chronicle UDM fields. Starting from Line 3: you can do something like this:
event:
// base search
// make sure you assign your variable
// lets assume that variables are $hostname, $vendor
match:
  $hostname, $vendor over 24h
outcome:
  $last_event timestamp.current_seconds() - max($e.metadata.ingested_timestamp.seconds)
condition:
  $e and $last_event > 14400 //4 hours

Issues with this is that all the events that contributed to this will be present in the alerts. But you could user do the outcome line in the "event" step to also reduce the number of events.
18000 <= timestamp.current_seconds() - $e.metadata.ingested_timestamp.seconds // this will return any event ingested within the last 5 hours
I would not recommend doing this search on a log type that is loud.- Mark as New
- Bookmark
- Subscribe
- Mute
- Subscribe to RSS Feed
- Permalink
- Report Inappropriate Content
- Mark as New
- Bookmark
- Subscribe
- Mute
- Subscribe to RSS Feed
- Permalink
- Report Inappropriate Content
Sorry one last doubt how to convert the epoch time to human readable format in chronicle .
- Mark as New
- Bookmark
- Subscribe
- Mute
- Subscribe to RSS Feed
- Permalink
- Report Inappropriate Content
- Mark as New
- Bookmark
- Subscribe
- Mute
- Subscribe to RSS Feed
- Permalink
- Report Inappropriate Content
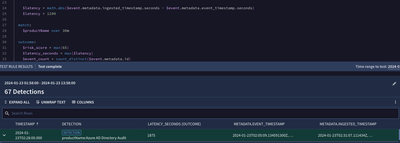
There are a set of functions in YARA-L that convert epoch time to portions of a date field for analysis, but there is not one currently in Chronicle that takes an epoch and reconstructs it as a mm/dd/yy HH:MM:SS, for example. Based on what you are looking for above reconstruction of a date does not seem to be needed. You could grab the hour, minute, day of the week, week of the year in those function if desired.
Here is a snippet of a latency rule I built for a cloud service. All timestamps in UDM are treated in this manner: https://protobuf.dev/reference/protobuf/google.protobuf/#timestamp
- Mark as New
- Bookmark
- Subscribe
- Mute
- Subscribe to RSS Feed
- Permalink
- Report Inappropriate Content
- Mark as New
- Bookmark
- Subscribe
- Mute
- Subscribe to RSS Feed
- Permalink
- Report Inappropriate Content
Sure let me check on this .Thanks for the response
One doubt where is this value getting saved
outcome:
  $last_event timestamp.current_seconds() - max($e.metadata.ingested_timestamp.seconds)
- Mark as New
- Bookmark
- Subscribe
- Mute
- Subscribe to RSS Feed
- Permalink
- Report Inappropriate Content
- Mark as New
- Bookmark
- Subscribe
- Mute
- Subscribe to RSS Feed
- Permalink
- Report Inappropriate Content
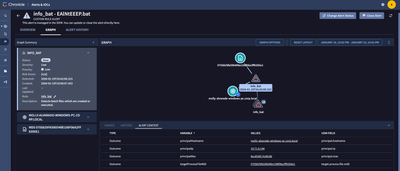
The outcome section value gets saved in the alert's Alert Context. This is visible when you go to an Alert, go to "Graph", then "Alert Context".
- Mark as New
- Bookmark
- Subscribe
- Mute
- Subscribe to RSS Feed
- Permalink
- Report Inappropriate Content
- Mark as New
- Bookmark
- Subscribe
- Mute
- Subscribe to RSS Feed
- Permalink
- Report Inappropriate Content
the outcome section should have an outcome variable defined at the front of the it so something like this:
outcome:
  $time_diff = $last_event timestamp.current_seconds() - max($e.metadata.ingested_timestamp.seconds)
time_diff will be available to use in the yara-l rule and will also reside in the detection schema that can be used in dashboards or in the soar or in third party tooling if applicable.
- Mark as New
- Bookmark
- Subscribe
- Mute
- Subscribe to RSS Feed
- Permalink
- Report Inappropriate Content
- Mark as New
- Bookmark
- Subscribe
- Mute
- Subscribe to RSS Feed
- Permalink
- Report Inappropriate Content
Hi @jstoner,
I am trying to find host not reporting alert .However it does not seem to be working
rule No_Logs_received {
  meta:
    author = "Rahul"
    description = "Developed to detect log stoppage scenario from host which indicate logging tampered on the host or connection termination from host to Chronicle which needs further investigation."
    severity = "Medium"

  events:
    $e.metadata.vendor_name = $vendor
    $e.principal.hostname = $hostname

    match:
    $hostname, $vendor over 24h

  outcome:
   $last_event = timestamp.current_seconds() - max($e.metadata.ingested_timestamp.seconds)

  condition:
  $e and $last_event > 86400
i did try what you suggested to include it in the event section as well , but its not giving me desired result
rule No_Logs_received {
  meta:
    author = "Rahul"
    description = "Developed to detect log stoppage scenario from host which indicate logging tampered on the host or connection termination from host to Chronicle which needs further investigation."
    severity = "Medium"

  events:
    $e.metadata.product_name = $product_name
    $e.principal.hostname = $hostname
    86400 > math.abs(timestamp.current_seconds() - ($e.metadata.ingested_timestamp.seconds))

    match:
    $hostname,$product_name over 24h

   condition:
  $e
}
My final result should be to show which devices has not reporting for more than 1 day and it was last reported time .
- Mark as New
- Bookmark
- Subscribe
- Mute
- Subscribe to RSS Feed
- Permalink
- Report Inappropriate Content
- Mark as New
- Bookmark
- Subscribe
- Mute
- Subscribe to RSS Feed
- Permalink
- Report Inappropriate Content
Couple of thoughts here:
We need to flip the greater than sign because we want the difference between now and the ingest to be more than some timeframe.
I know this is a stub rule and there are more things specific to the environment to add, but I added a net function to focus on a specific IP range to help pull this back otherwise it gets super busy.
The log type field versus product name might be a good choice to use if you are matching since multiple product values could use the same log type.
  events:
    $e.metadata.product_name = $product_name
    $e.principal.hostname = $hostname
    net.ip_in_range_cidr($e.principal.ip, "10.0.0.0/8")
    14400 < math.abs(timestamp.current_seconds() - ($e.metadata.ingested_timestamp.seconds))

    match:
    $hostname, $product_name over 24h
Because the rules engine is currently designed for a 48 hour window, it needs to have something to compare something to. So looking for matches in a 24 hour window and saying that the time boundary we are monitoring for is also 24 hours is not going to be where we want to be. We could say look over the past 24 hours for events and then tell me which events we have not ingested in the past 4 hours, which is what I have above. It still may be a bit noisy but get you going.
We are continuing to evolve the platform and later this year we may have some additional methods to do this over broader time windows as well... Hope this helps.
- Mark as New
- Bookmark
- Subscribe
- Mute
- Subscribe to RSS Feed
- Permalink
- Report Inappropriate Content
- Mark as New
- Bookmark
- Subscribe
- Mute
- Subscribe to RSS Feed
- Permalink
- Report Inappropriate Content
Has anyone tried the "Security Rule Translator" Converter?
(URL Removed by Staff)
Thanks.
-
Admin
24 -
AI
1 -
API
16 -
Applied Analytics
2 -
BigQuery
3 -
Browser Management
2 -
Chrome Enterprise
2 -
Chronicle
10 -
Compliance
5 -
Curated Detections
9 -
Custom List
1 -
Dashboard
9 -
Data Management
32 -
Ingestion
46 -
Investigation
24 -
Logs
2 -
Parsers
52 -
Rules Engine
65 -
Search
30 -
SecOps
2 -
Security Command Center
1 -
SIEM
20 -
Siemplify
1 -
Slack
1 -
Threat Intelligence
18
- « Previous
- Next »

 Twitter
