- Google Cloud
- Articles & Information
- Cloud Product Articles
- Cloud Armor - Creating Dashboards for Cloud Armor ...
- Subscribe to RSS Feed
- Mark as New
- Mark as Read
- Bookmark
- Subscribe
- Printer Friendly Page
- Report Inappropriate Content
- Article History
- Subscribe to RSS Feed
- Mark as New
- Mark as Read
- Bookmark
- Subscribe
- Printer Friendly Page
- Report Inappropriate Content
Introduction
Google Cloud Armor exports monitoring data from security policies to Cloud Monitoring. You can use monitoring metrics to check whether your policies are working as intended or to troubleshoot problems. For example, you can view the traffic that was blocked or allowed for each backend service. You can monitor the metrics of a single security policy (which can be applied to multiple backend services) or a single backend service.
In addition to the predefined dashboards in Monitoring, you can create custom dashboards, set up alert policies, and query the metrics through the Cloud Monitoring API.
Google Cloud Armor per-request logs for security policy name, match rule priority, associated action, and related information are logged as part of logging for HTTP(S) Load Balancing, External TCP Proxy Load Balancing, and External SSL Proxy Load Balancing. Logging for new backend services is disabled by default, so you must enable logging to record complete logging information for Google Cloud Armor.
Because Google Cloud Armor logs are part of the Cloud Load Balancing logs, Google Cloud Armor log generation is subject to the log sampling rate configured for your load balancer. If you reduce the sampling rate for your HTTP(S) Load Balancing, External TCP Proxy Load Balancing, or External SSL Proxy Load Balancing, your Google Cloud Armor requests logs are sampled at that reduced rate.
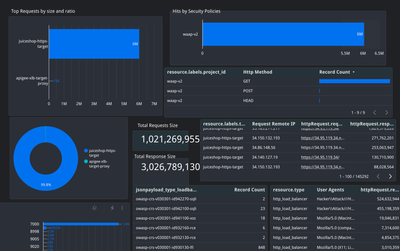
From your Cloud Armor logs, you are able to create a dashboard in Looker Studio similar to the below.
Using logging, you can view every request evaluated by a Google Cloud Armor security policy and the outcome or action taken. For example, to view denied requests, you can use filters such as
jsonPayload.enforcedSecurityPolicy.outcome="DENY"
or
jsonPayload.statusDetails="denied_by_security_policy"
This article describes how to create rich visualization dashboards from logs generated by Cloud Armor. ( as mentioned above, Google Cloud Armor logs are part of the Cloud Load Balancing logs)
It will show the various GCP services involved in setting this up in a quick and easy manner.
Pre-requisite
The following services will need to be configured as a base for this blogpost
- Cloud Armor Network security Policy
- Google Cloud External Load balancer with backend, http healthcheck and workload setup and configured
The following services will be configured as part of this tutorial or blogpost
- Log Sink in Cloud Logging
- BigQuery
- Data Studio
Step 1: Create a Log Sink
In this step, we need to tell GCP to dump the specific log which contains the Cloud Armor Policy Rule execution into a Big Query Table
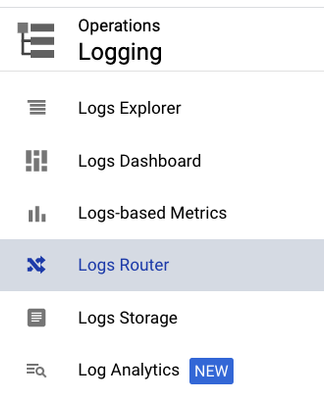
- a) In the GCP console, Go to the “Logging” service in the GCP left hand navigation menu, and select the “Logs Router”
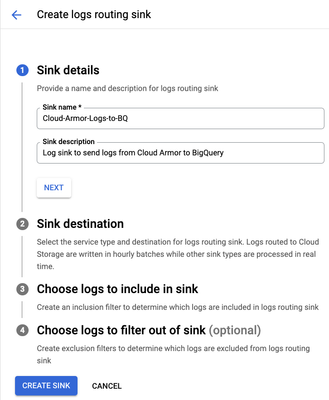
b) Click on "Create Sink" ( as shown below)and Enter the required details
“Sink Name” such as Cloud-Armor-Logs-to-BQ and also give a description of the sink
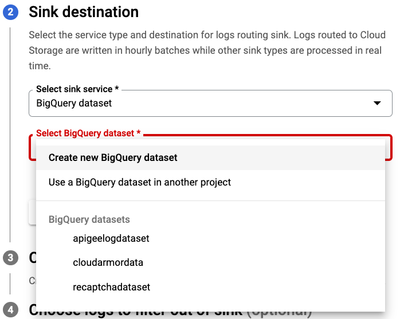
Click Next and in the "Select sink service" dropdown select "BigQuery Dataset"
And select "Create new BigQuery dataset" if you have not created one already.
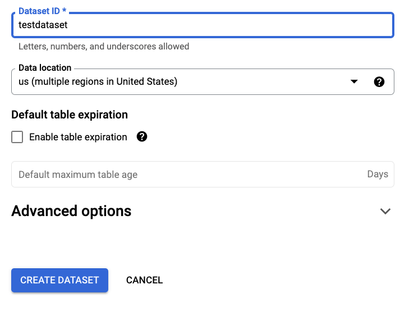
Put in your dataset ID and also set Data Location to your preferred Data location. and click on Create DATASET
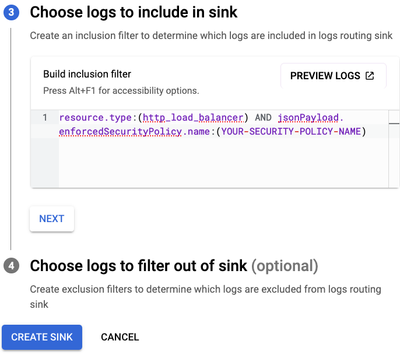
After this is created Choose logs to include in the sink by typing the query from Cloud Logging for the Cloud Armor Logs ( You can get this easily by clicking on the View Policy Logs link in Cloud Armor, which will automatically redirect you to Cloud Logging and show you the query in the Logs Explorer) and logs to filter out of the sink
Now all future “http_load_balancer” logs will get stored in BigQuery under the new dataset you requested. The table with your data will be called “requests”
Step 2: Configure a Looker Studio Report
You can create Looker Studio reports in the following ways:
- Create a new blank report
- Create a report from a template
- Create a report from a product integration
In this tutorial, we will cover creating a new blank report.
Create a new blank report
- Sign in to Looker Studio.
- In the top left, click the coloured Plus sign
- Click on Create, then select Report.
- Select "Connect to Data" and choose BigQuery
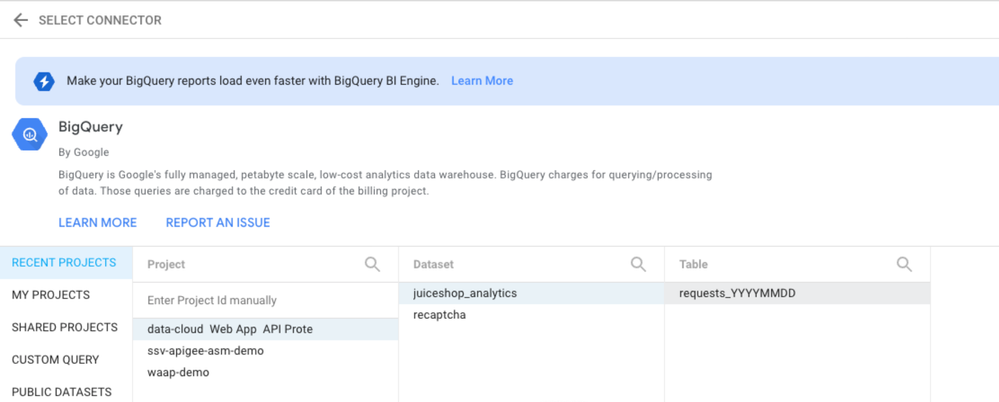
- We will select the Project Name and then the BigQuery DataSet we made earlier and then select the request table created (as shown below) and click add in the bottom right ( the data source will be added to your report)
- A table appears with fields from that data source.
- A table appears with fields from that data source
- Use the properties panel on the right to change the data and style of the table.
Chart Selection
A table will appear with fields from the BigQuery data source. In the top left, name your report by clicking Untitled Report and then entering a new name. You can use the properties panel on the right to add data to your report.
Select the types of Charts you wish to create, table, bar, pie charts, etc
As an example, to create a Table as shown below
At the top of the report -
- select add a chart
- Choose a table
- ensure it drops into the report.
From the chart menu on the right, select the following as dimensions to be added into the table horizontally
- resource.labels.target_proxy_name
- httpRequest.remoteIp
- httpRequest.requestUrl
- httpRequest.responseSize
You can choose to leave the record count metric if you desire.
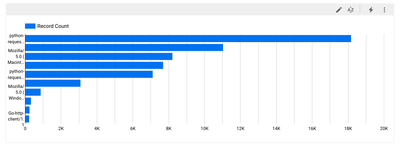
To create a bar chart such as the one shown above, use the following steps.
At the top of the report,
- select add a chart
- choose the bar chart with the blue horizontal bars
- On the Chart menu on the right set the Dimension for the chart to be httprequest.userAgent

 Twitter