- Google Cloud
- Articles & Information
- Cloud Product Articles
- BYOP - Bring your own Prometheus (and Grafana) to ...
- Subscribe to RSS Feed
- Mark as New
- Mark as Read
- Bookmark
- Subscribe
- Printer Friendly Page
- Report Inappropriate Content
- Article History
- Subscribe to RSS Feed
- Mark as New
- Mark as Read
- Bookmark
- Subscribe
- Printer Friendly Page
- Report Inappropriate Content
With a distributed system like Apigee hybrid monitoring is a core requirement to ensure the stability and availability of the platform. For this reason Apigee hybrid comes with native integration into the Google Cloud Logging and Monitoring stack that allows platform operators to collect important telemetry data in a central place and without operating their own monitoring infrastructure.
In scenarios where organizations have standardized on a unifying monitoring stack or require manipulation or archival features that are not supported with Cloud Monitoring, they might want to run their own metrics collection in parallel or instead of the Apigee metrics collection.
In this article we address this need by demonstrating a deployment of a custom end to end metrics path based on the popular open-source tool Prometheus and Grafana. This monitoring setup allows you to capture and visualize important infrastructure and runtime metrics of your Apigee hybrid deployment.
(Optional) Cluster-internal service for the demo
In order to generate metrics that we can then scrape and visualize with our metrics stack we deploy an in-cluster service that we can front with an Apigee API proxy.
To create an in-cluster httpbin deployment and service, we can apply the following Kubernetes resources:
cat <<EOF | kubectl apply -f -
apiVersion: v1
kind: Namespace
metadata:
  name: httpbin
---
apiVersion: apps/v1
kind: Deployment
metadata:
  name: httpbin
  namespace: httpbin
spec:
  replicas: 1
  selector:
    matchLabels:
      app: httpbin
  template:
    metadata:
      labels:
        app: httpbin
    spec:
      containers:
      - name: httpbin
        image: kennethreitz/httpbin
        resources:
          limits:
            memory: "64Mi"
            cpu: "50m"
        ports:
        - containerPort: 80
---
apiVersion: v1
kind: Service
metadata:
  name: httpbin
  namespace: httpbin
spec:
  selector:
    app: httpbin
  ports:
  - port: 80
    targetPort: 80
EOF
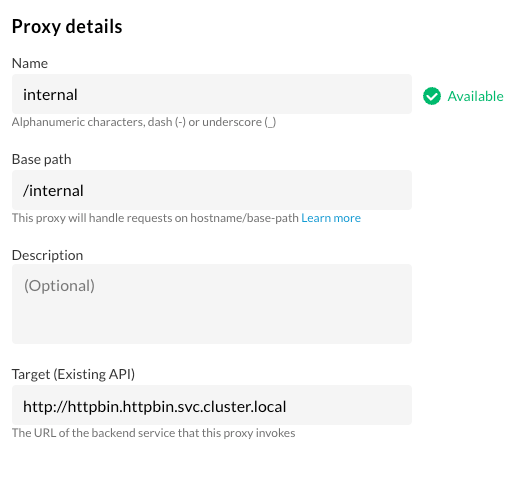
We can use the service’s cluster internal hostname (http://httpbin.httpbin.svc.cluster.local) to create a proxy in Apigee:
And finally verify that we can call the service with the following curl command:
curl https://$HOSTNAME/internal/uuid

# Response:
{
  "uuid": "d338600c-59d2-4c76-884d-44d7f12ebb72"
}
If to create some data to show in your dashboards you can run the following command:
while true
do
  curl https://$HOSTNAME/internal/uuid
  sleep 1
done
In the output below you see that the metrics is configured to be exported to cloud logging and monitoring for the indicated project ID:
metricsExport:
  appMetricsProjectID: my-project-name
  defaultMetricsProjectID: my-project-name
  enabled: true
  proxyMetricsProjectID: my-project-name
  stackdriverAPIEndpoint: https://monitoring.googleapis.com:443/
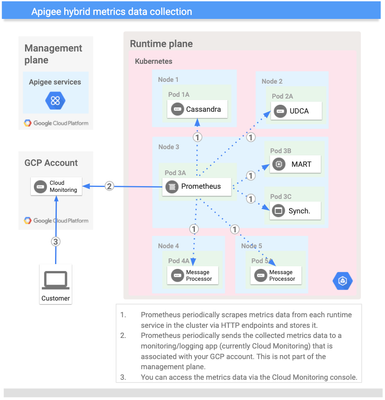
Based on the information in the ApigeeTelemetry CR the Apigee controller creates the metrics deployment for the pods that scrape the different runtime resources and ship the aggregated metrics to the Cloud Monitoring endpoint that is referred to as the “stackdriverAPIEndpoint” in the configuration above.
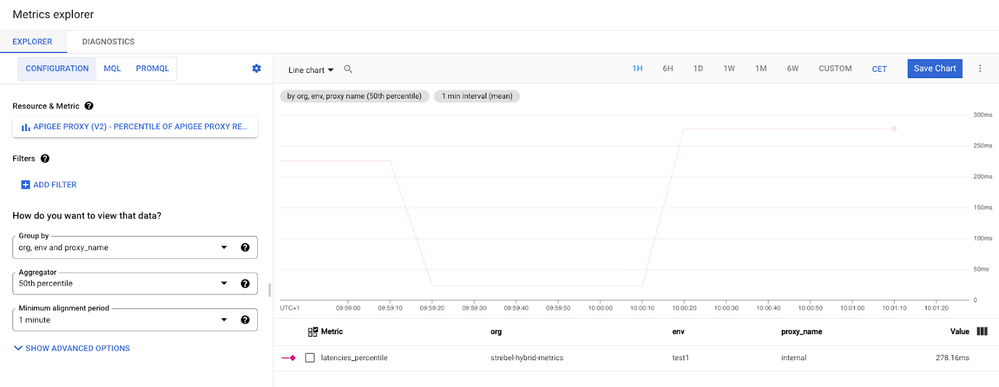
To start exploring the available Apigee runtime metrics we can go into the GCP metrics explorer and look for example at the percentile distribution of response latencies.
The screenshot above shows that, Apigee already comes with a number of proxy metrics that are also pre-populated with handy labels that can be used to group the data by dimensions such as Apigee environment, Apigee organization or the name of the API proxy.
Deploying your own Prometheus and Grafana in the Apigee hybrid cluster
For the purpose of this article we will install Prometheus and Grafana with the help of the prometheus operator in the kube-prometheus tooling set. The concept of bringing your own Prometheus to monitor Apigee is not dependent on the operator installation and can just as well be applied on a Prometheus that was deployed using helm or a custom installation path.
To install the Prometheus Operator on our hybrid cluster we run the following commands (for a detailed explanation of the prometheus operator please see the official documentation.)
git clone https://github.com/prometheus-operator/kube-prometheus.git
kubectl apply --server-side -f manifests/setup
kubectl wait \
	--for condition=Established \
	--all CustomResourceDefinition \
	--namespace=monitoring
kubectl apply -f manifests/
Let’s check the Prometheus scraping works as expected by port-forwarding the prometheus service.
kubectl --namespace monitoring port-forward svc/prometheus-k8s 9090
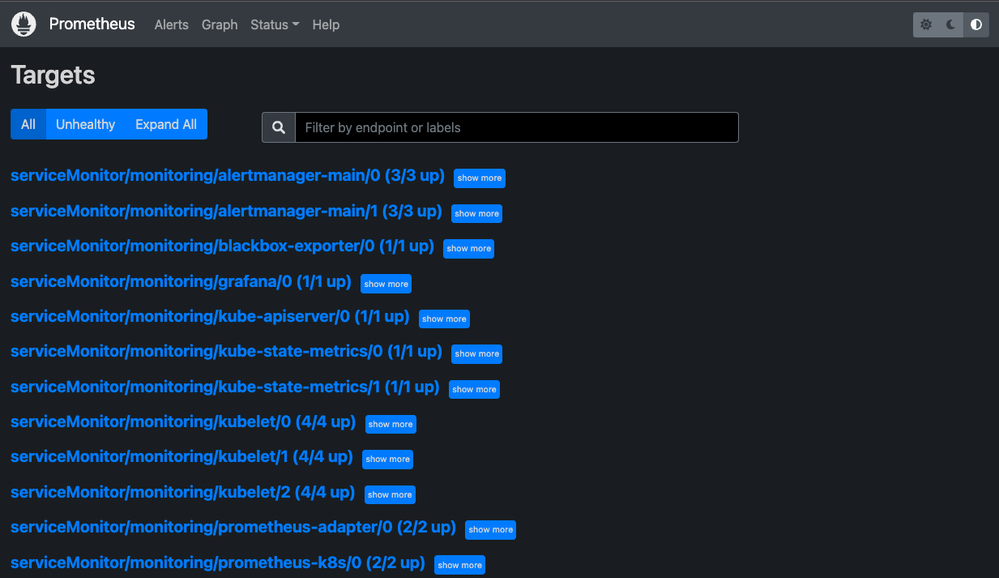
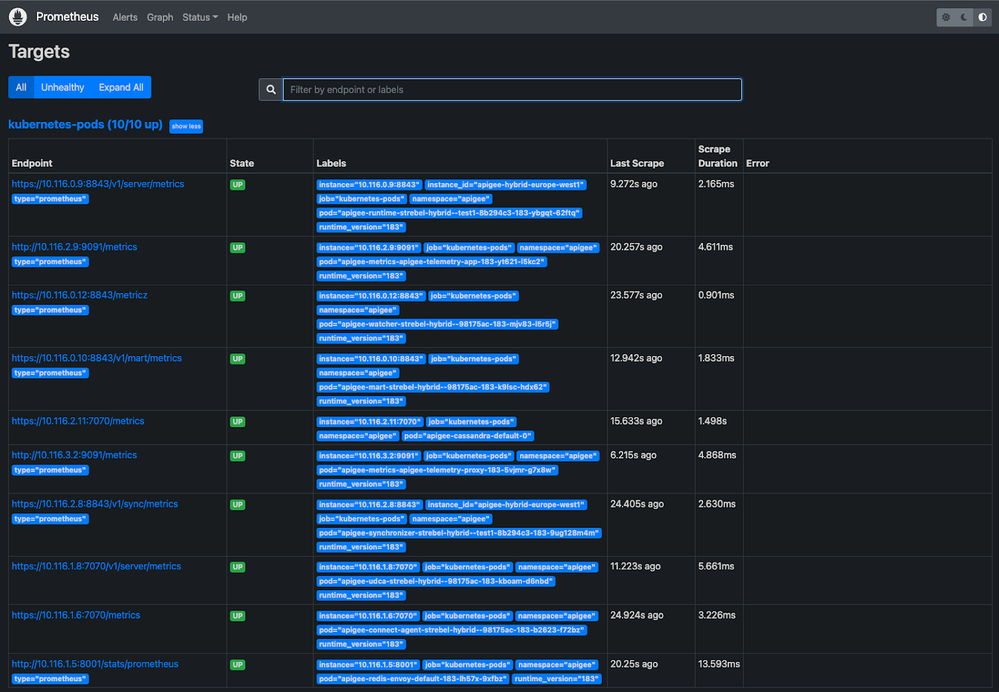
With the port forwarding enabled we can now open the Prometheus UI in our local web browser under http://localhost:9090/targets. Here you should see the automatically configured service monitors as shown in the picture below:
If you look around you’ll realize that there are lots of interesting infrastructure metrics. Kube-prometheus aso deployed a Grafana instance and nice pre-populated dashboards that you can access by port-forwarding the Grafana UI:
kubectl --namespace monitoring port-forward svc/grafana 3000
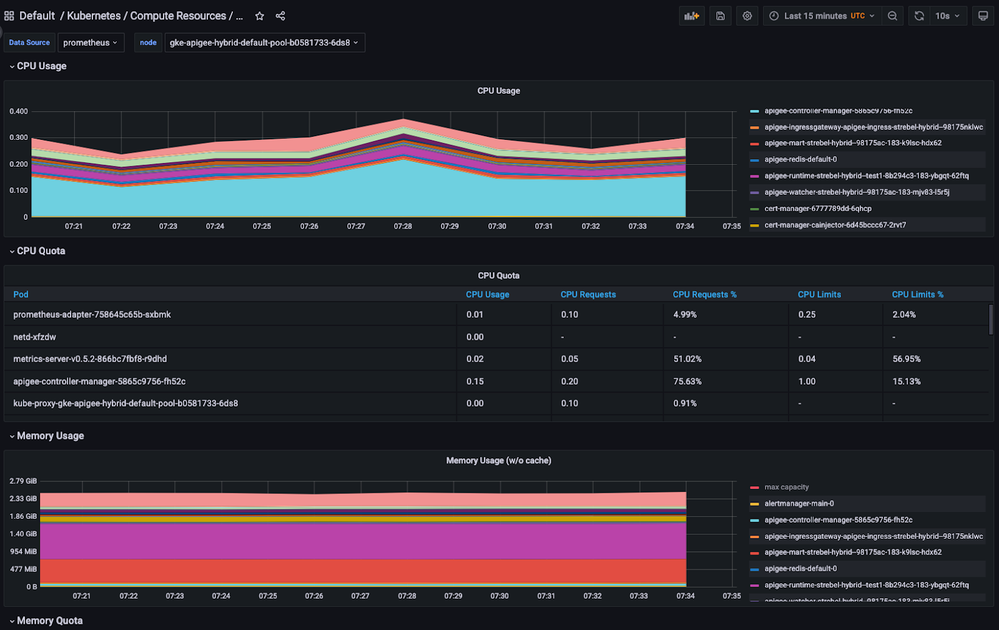
When you open the Grafana UI in your browser and log in with the default credentials (admin:admin) you find that the prom-kube distribution already comes with many pre-installed dashboards that describe the resource utilization and infrastructure metrics like in the following screenshot:
Getting the Apigee metrics into Prometheus
When we took a closer look at the data and dashboards provided above, we saw that we get very rich generic information about the Apigee runtime resource like the CPU and memory usage of the pods, API server performance and pod restarts. However, we lack the Apigee specific information like the API proxy performance that was available in the Cloud Monitoring metrics explorer as shown initially.
Luckily the Apigee pods all come with prometheus annotations that allow you to automatically discover their scraping configuration. You can see this for example on the Apigee Runtime pods:
kubectl get pods -l app=apigee-runtime -o yaml -n apigee

apiVersion: v1
items:
- apiVersion: v1
  kind: Pod
  metadata:
    annotations:
	...
      prometheus.io/path: /v1/server/metrics
      prometheus.io/port: "8843"
      prometheus.io/scheme: https
      prometheus.io/scrape: "true"
      prometheus.io/type: prometheus
    labels:
      ...
      app: apigee-runtime
      ...
      revision: "183"
      runtime_type: hybrid
    name: apigee-runtime-...
    namespace: apigee
...
To get the Apigee metrics into your prometheus we have to create an additional scrape config as a Kubernetes secret to our monitoring namespace. (The scrape information here isn’t particularly sensitive but the prometheus CR will expect the additional scrape config in the form of a secret.)
cat <<'EOF' >prom-additional-scrape.yaml
- job_name: kubernetes-pods
  honor_timestamps: true
  scrape_interval: 30s
  scrape_timeout: 10s
  metrics_path: /metrics
  scheme: http
  tls_config:
    insecure_skip_verify: true
  follow_redirects: true
  enable_http2: true
  kubernetes_sd_configs:
  - role: pod
    kubeconfig_file: ""
    follow_redirects: true
    enable_http2: true
  relabel_configs:
  - source_labels: [__meta_kubernetes_pod_annotation_prometheus_io_scrape]
    separator: ;
    regex: "true"
    replacement: $1
    action: keep
  - source_labels: [__meta_kubernetes_pod_container_init]
    separator: ;
    regex: "true"
    replacement: $1
    action: drop
  - source_labels: [__meta_kubernetes_pod_label_apigee_cloud_google_com_platform]
    separator: ;
    regex: apigee
    replacement: $1
    action: keep
  - source_labels: [__meta_kubernetes_pod_annotation_prometheus_io_scheme]
    separator: ;
    regex: (.+)
    target_label: __scheme__
    replacement: $1
    action: replace
  - source_labels: [__meta_kubernetes_pod_annotation_prometheus_io_path]
    separator: ;
    regex: (.+)
    target_label: __metrics_path__
    replacement: $1
    action: replace
  - source_labels: [__meta_kubernetes_pod_annotation_prometheus_io_type]
    separator: ;
    regex: (.+)
    target_label: __param_type
    replacement: $1
    action: replace
  - source_labels: [__address__, __meta_kubernetes_pod_annotation_prometheus_io_port]
    separator: ;
    regex: ([^:]+)(?::\d+)?;(\d+)
    target_label: __address__
    replacement: $1:$2
    action: replace
  - source_labels: [__meta_kubernetes_namespace]
    separator: ;
    regex: (.*)
    target_label: namespace
    replacement: $1
    action: replace
  - source_labels: [__meta_kubernetes_pod_name]
    separator: ;
    regex: (.*)
    target_label: pod
    replacement: $1
    action: replace
  - source_labels: [__meta_kubernetes_pod_label_instance_id]
    separator: ;
    regex: (.*)
    target_label: instance_id
    replacement: $1
    action: replace
  - source_labels: [__meta_kubernetes_pod_label_com_apigee_version]
    separator: ;
    regex: (.*)
    target_label: runtime_version
    replacement: $1
    action: replace
EOF

kubectl create secret generic additional-scrape-configs --from-file=prom-additional-scrape.yaml --dry-run=client -oyaml | kubectl apply -n monitoring -f -
Finally we patch the Prometheus CR to include the additional scrape configuration such that it is picked up and integrated into Prometheus’ overall configuration. We also expand the Prometheus serviceaccount's permissions to allow scraping of the pods instead of just the nodes.
cat <<EOF | >> manifests/prometheus-prometheus.yaml
  additionalScrapeConfigs:
    name: additional-scrape-configs
    key: prom-additional-scrape.yaml
EOF
kubectl apply -f manifests/prometheus-prometheus.yaml

cat <<EOF | kubectl apply -f -
apiVersion: rbac.authorization.k8s.io/v1
kind: ClusterRole
metadata:
  name: prometheus-apigee
rules:
- apiGroups: [""]
  resources:
  - nodes
  - nodes/proxy
  - services
  - endpoints
  - pods
  verbs: ["get", "list", "watch"]
- apiGroups: [""]
  resources:
  - configmaps
  verbs: ["get"]
- apiGroups:
  - networking.k8s.io
  resources:
  - ingresses
  verbs: ["get", "list", "watch"]
- nonResourceURLs: ["/metrics"]
  verbs: ["get"]
---
apiVersion: rbac.authorization.k8s.io/v1
kind: ClusterRoleBinding
metadata:
  name: prometheus-apigee
roleRef:
  apiGroup: rbac.authorization.k8s.io
  kind: ClusterRole
  name: prometheus-apigee
subjects:
- kind: ServiceAccount
  name: prometheus-k8s
  namespace: monitoring
EOF
Once applied, Prometheus will reload the config and start to show the newly discovered targets for the Apigee pods:
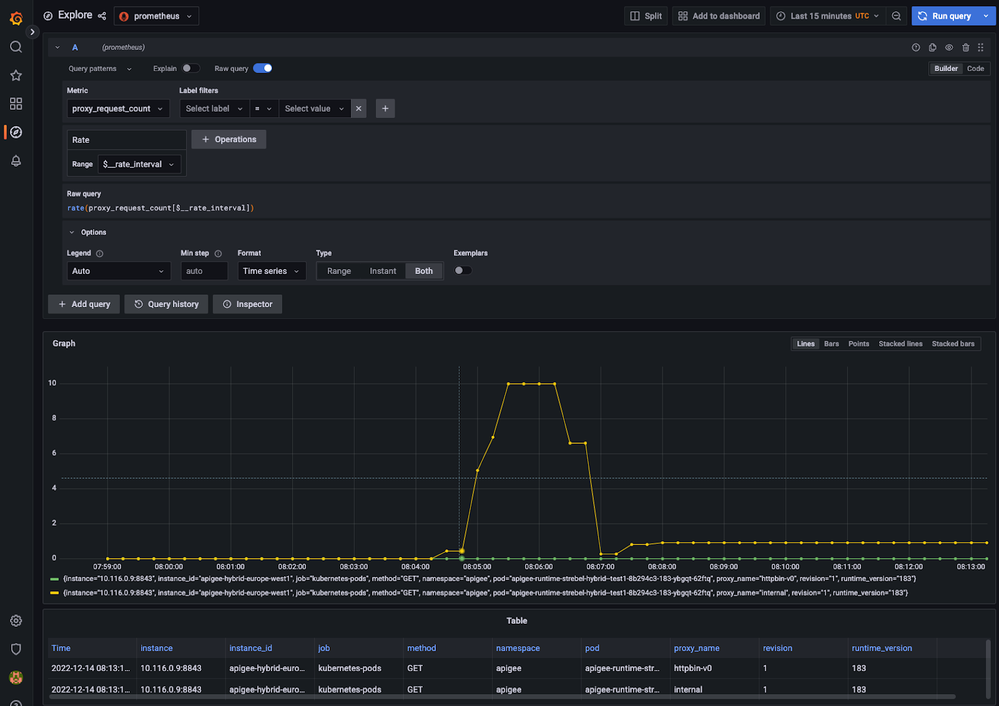
With the query tool in the prometheus UI we are now able to show the Apigee specific proxy metrics (e.g. proxy_request_count) that we used to get in Cloud Monitoring.
As a last step we can head back to Grafana's Metrics Explorer and validate that we have the relevant data available e.g. to create a new QPS chart for the proxies:
Conclusion
As shown in this article, the existing prometheus metrics endpoints can easily be scraped by a custom prometheus deployment and to provide targeted metrics pipelines that integrate with the rest of your infrastructure monitoring stack.
- Mark as Read
- Mark as New
- Bookmark
- Permalink
- Report Inappropriate Content
thanks, can we do the same for other tools such as new relic or dynatrace i.e scrape these apigee specific metrics to these tools or agents.
- Mark as Read
- Mark as New
- Bookmark
- Permalink
- Report Inappropriate Content
The metrics endpoints are in Prometheus format but most metrics solutions have support for ingesting Prometheus metrics (incl. dynatrace and new relic).
You might also be interested in @ncardace 's posts on getting the opentelemetry tracing information into new relic and dynatrace:
- Mark as Read
- Mark as New
- Bookmark
- Permalink
- Report Inappropriate Content
thanks @strebel we will check this.
also, we followed the prometheus steps you shared and tried installing the prometheus on AWS EKS cluster for Apigee Hybrid metrics. The Installation was successful and we are able to see the Prometheus UI and the default kubernetes metrics , but even after applying the additional scrape configs , we are still unable to see apigee specific metrics like "proxy_request_count" in prometheus UI. Please let us know if any additional configurations required. Our setup - Apigee Hybrid setup on AWS EKS Cluster , and logging enabled during installation.

 Twitter