This website uses Cookies. Click Accept to agree to our website's cookie use as described in our Privacy Policy. Click Preferences to customize your cookie settings.
Turn on suggestions
Auto-suggest helps you quickly narrow down your search results by suggesting possible matches as you type.
Showing results for
- Google Cloud
- Articles & Information
- Cloud Product Articles
- APM integration with Apigee
Topic Options
- Subscribe to RSS Feed
- Mark as New
- Mark as Read
- Bookmark
- Subscribe
- Printer Friendly Page
- Report Inappropriate Content

 LinkedIn
 Twitter
sarthak
New Member
Topic Options
- Article History
- Subscribe to RSS Feed
- Mark as New
- Mark as Read
- Bookmark
- Subscribe
- Printer Friendly Page
- Report Inappropriate Content
5
0
10.9K
This represents work done with multiple customers on this topic over the last few years and we intend to modify/update these design patterns as we get more feedback. Thanks to @Dallen, who contributed to the effort creating this article.
What is APM?
First, let's make sure we're all starting from some common definitions. The category of products that includes APM, server monitoring, application monitoring, and so on, can seem to be crowded with many overlapping functions. For a brief review of APM, what it is and what distinguishes it from other kinds of monitoring, a good short read is here: http://blogs.gartner.com/jonah-kowall/2014/02/14/application-monitoring-is-not-application-performan...
Problem statement:
Information Technology departments in medium to large enterprises are increasingly embracing commercial off the shelf solutions for application performance management. Application performance management (APM) is the monitoring and management of performance and availability of software applications. APM strives to detect and diagnose complex application performance problems to maintain an expected level of service. APM solutions typically span all layers of an IT infrastructure including client applications, middleware tools, back end systems, databases, and the like.
Apigee Edge customers often have heavy investment in various APM tools. These tools span both public cloud, private cloud, and on premises hosted infrastructure components. Customers have increasingly requested guidance and best practices for integrating Apigee Edge with APM solutions. APM vendors and products include, Computer Associates, AppDynamics, New Relic, DynaTrace, Quest, Riverbed, HPE and others.
Applicability to Apigee Edge:
Apigee Edge plays a particularly important role for ensuring that APM is properly implemented within the enterprise. Generally speaking, APM vendors gather information from all participants in a transaction or systems interaction by collecting data tagged with a correlation ID. Typically, the correlation ID allows the APM systems to stitch together various metrics to give an end to end view of the transaction or systems interaction.
While for many use cases the enterprise has end to end control having provided client applications, it is not uncommon for Apigee Edge typically to be the initial point of ingress to enterprise managed systems for non enterprise controlled consumers. Think about cases where an enterprise has exposed public, or partner, accessible APIs. While these may be registered and approved applications, they are not under the direct control of the enterprise themselves and as such likely do not have APM vendor instrumentation “built-in”. In these scenarios, Edge can be configured to provide APM visibility from the point of ingress back through the full enterprise stack. In an bundle, this typically means adding conditional policies to inject a correlation id into a header when one is not already present in an API call.
Generally, enterprises utilize vendor provided application libraries to instrument their front end and back end systems. This provides application level metrics to the APM tool that can be used to provide fine grained views of the entire software stack within the custom built application.
Given that Apigee Edge is a commercial off the shelf package, we have chosen not to provide instrumentation of the Edge stack itself. Having said that, it is possible to use JMX to gather some information for on premises customers. Nevertheless, Apigee Edge does not plan to provide platform level instrumentation for APM. Rather, we encourage customers to instrument the proxy bundle, the basic unit of configuration within Edge, for APM consumption.
For example, rather than gathering information about JVM characteristics, enterprises are encouraged to record information such as proxy latency either in aggregate through integration to the Edge Analytics subsystem or in detail via syslog integration in the proxy configuration itself. In this way, the enterprise is focusing on instrumentation and diagnosis of their traffic overall of the configuration of a particular API proxy rather than the Edge platform itself.
As mentioned previously, customers will have significantly more opportunity to instrument the operation of the Edge stack in an on premises or private cloud environment. Using OS level tooling, they can examine resource utilization such as CPU, RAM, disk, network, etc. Public cloud, or SaaS customers will not have access to this level of detail. Given that SaaS customers have procured a service that happens to be provided by a partially multi tenant infrastructure it would be inappropriate for Apigee to share low level data and further would blur the lines of responsibility for monitoring, sustaining, and remediating that infrastructure.
At a very high level APM can be used in two ways-
Track a transaction across all the different layers:
In this case the primary use case is to track an application end to end i.e. starting from Browser app/mobile apps to various middleware applications, databases,backend servers etc.

Co relate the transaction from business level to infrastructure level
When an error happened at business level, you should be able to track down if it happened because of out of memory error at OS level or not - You won’t be able to do this using Apigee.
You should be separately able track infra failure and any API failure. But if a service callout fails due to permgen space error on disk you won’t be able to co relate that.
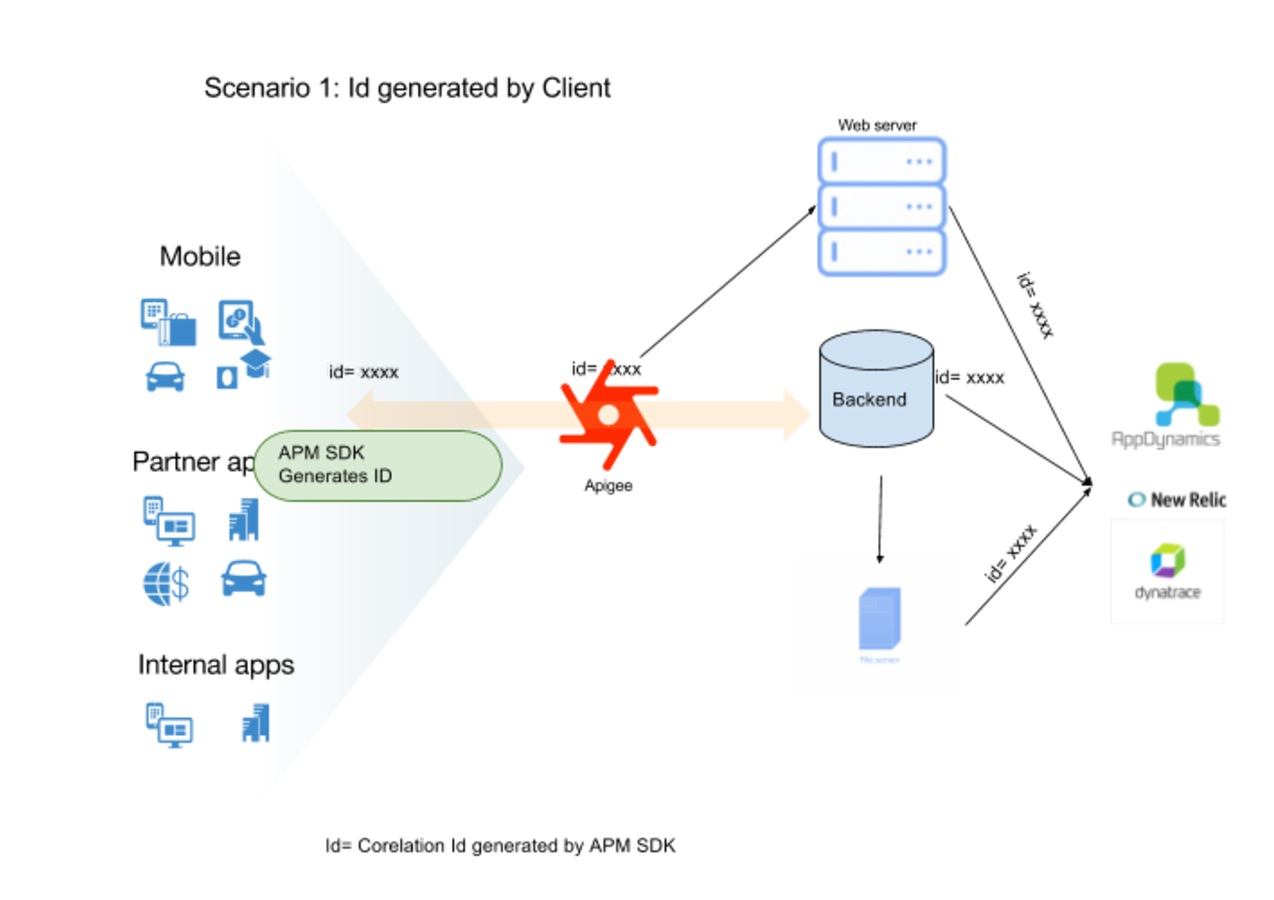
Scenario 1: ID Generated by Client

- Typically the apps will have the SDK agent running which can generate the IDs.
- In this case Apigee Edge primarily acts as a passthrough. It sends the ID received from the client to the backend systems.
- Apigee can be configured to put additional data as part of the request using custom headers.
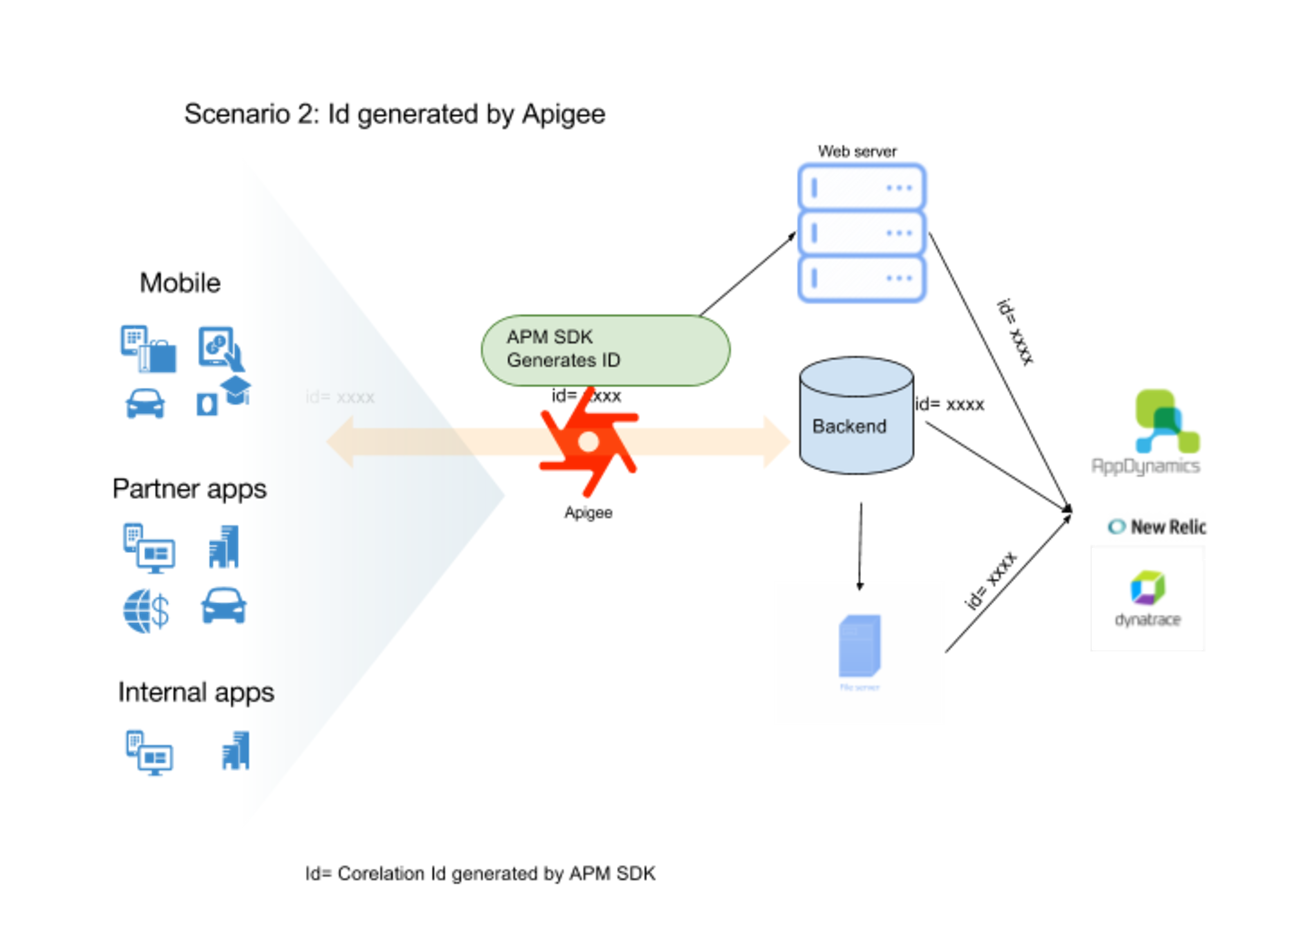
Scenario 2: ID generated by Apigee

- Apigee edge can do that ID generation instead.
- Majority of the APMs have SDKs in python/java/javascript which can be used as a policy inside Apigee to generate the IDs. If you are using AppDynamics you can see the SDK here: https://github.com/Appdynamics/AppDRESTAPI-SDK
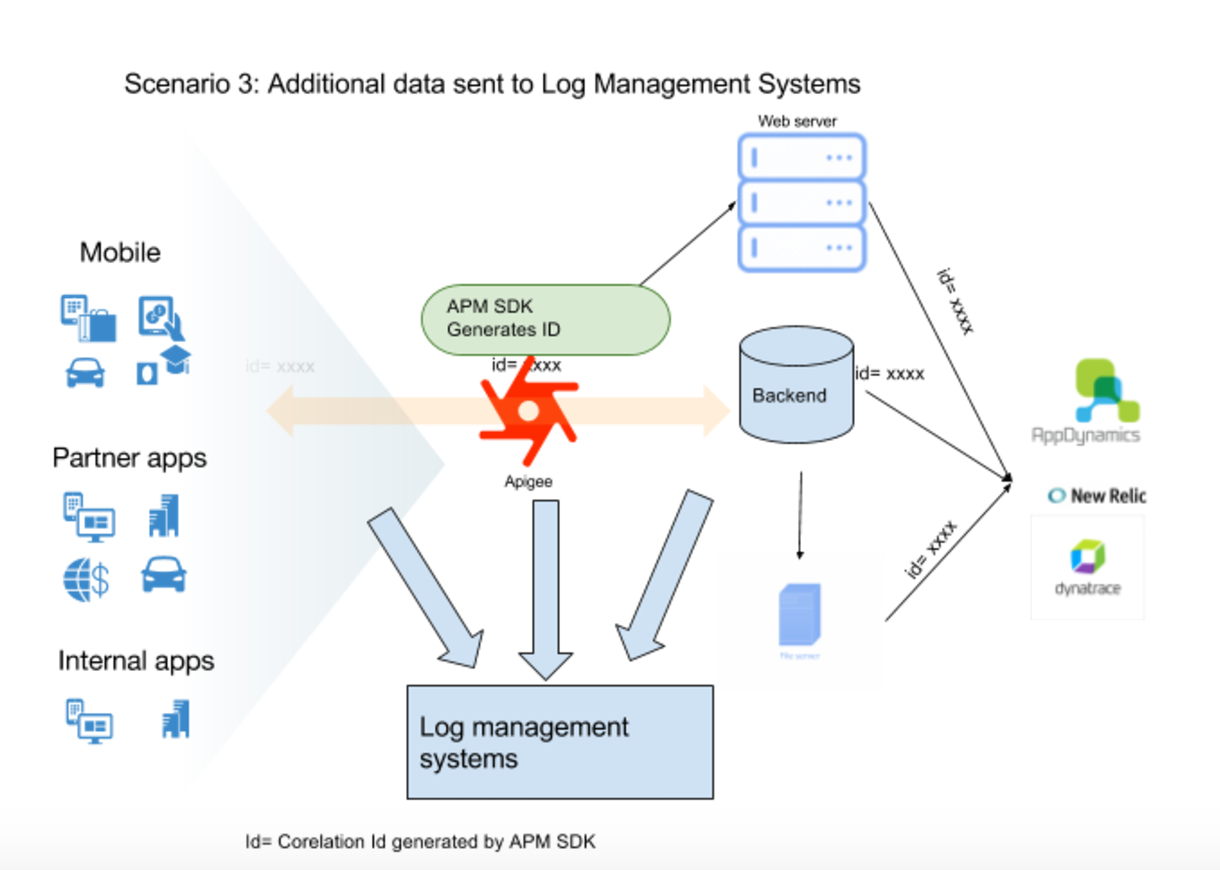
Scenario 3: Apigee sends additional data to log management systems

- This data can be sent along with the APM ID. So APMs can gather important information from the log data by polling the log systems.
Couple of considerations:
Apigee is primarily built using Java. But please don’t treat Apigee Edge as a Java application, or please don’t try to do JVM profiling to monitor Apigee Edge.
We often time hear from customers asking for class/method names so that they can instrument Apigee like any home grown java application. This won’t work and is not supported. You should rather treat Apigee like you would treat a database where you can only monitor the jdbc connections and not the internal code of the database. Using Apigee’s policy framework you can very closely monitor the HTTP request/responses but you won’t be able to monitor Apigee’s source code.
Topic Labels