- Google Cloud
- Cloud Forums
- Apigee
- Eval version Javascript Policy debug
- Subscribe to RSS Feed
- Mark Topic as New
- Mark Topic as Read
- Float this Topic for Current User
- Bookmark
- Subscribe
- Mute
- Printer Friendly Page
- Mark as New
- Bookmark
- Subscribe
- Mute
- Subscribe to RSS Feed
- Permalink
- Report Inappropriate Content
- Mark as New
- Bookmark
- Subscribe
- Mute
- Subscribe to RSS Feed
- Permalink
- Report Inappropriate Content
Hi
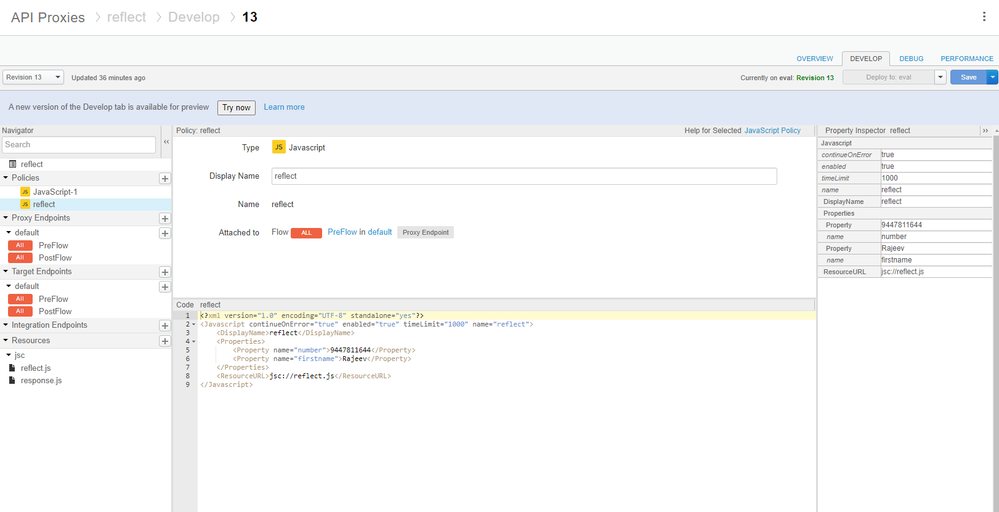
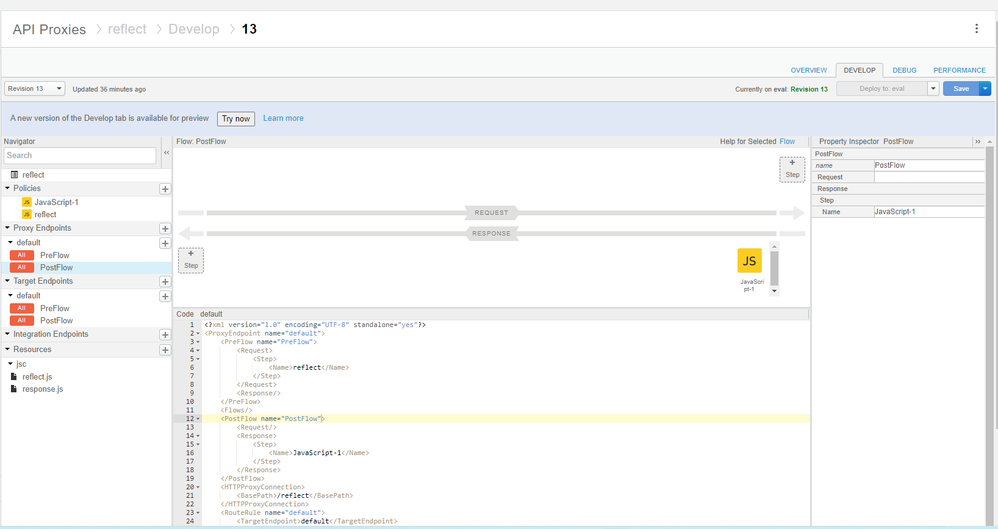
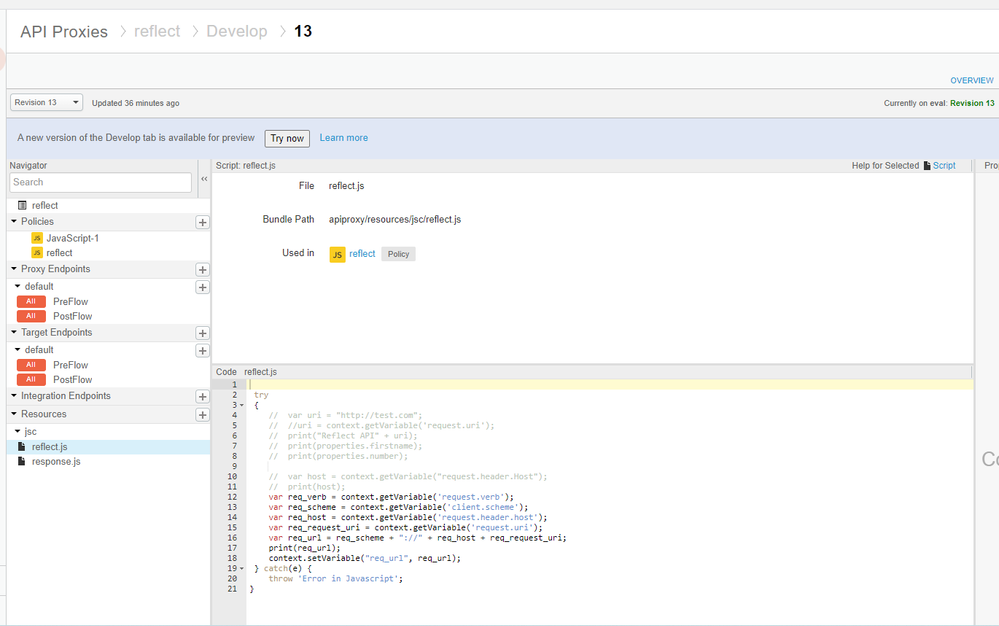
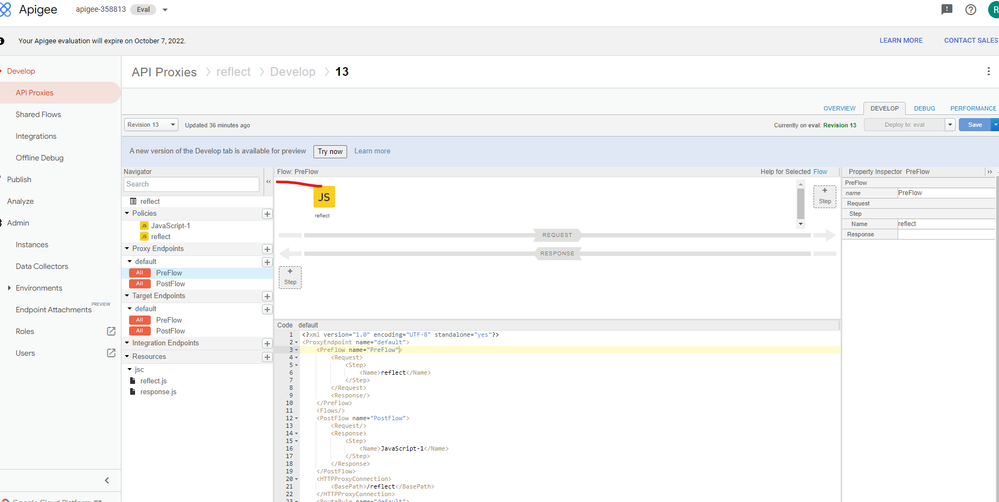
I am facing a strange issue with APIGee evaluation version in GCP. When I add a Javascript policy in APIProxy the debug /trace function stops working. Can someone help me understand why it does not work or where I can find the logs.
Even the simple javascript statement like the below one work in trial version at https://apigee.google.com/
print("Hello World");
context.setVariable("request.queryparam.a",10);
regards
Solved! Go to Solution.
- Mark as New
- Bookmark
- Subscribe
- Mute
- Subscribe to RSS Feed
- Permalink
- Report Inappropriate Content
- Mark as New
- Bookmark
- Subscribe
- Mute
- Subscribe to RSS Feed
- Permalink
- Report Inappropriate Content
The biggest problem I see in the evaluation version is that the Debug function works once in a while. Is there any restrictions on using that. Many times the Debug just remains empty.
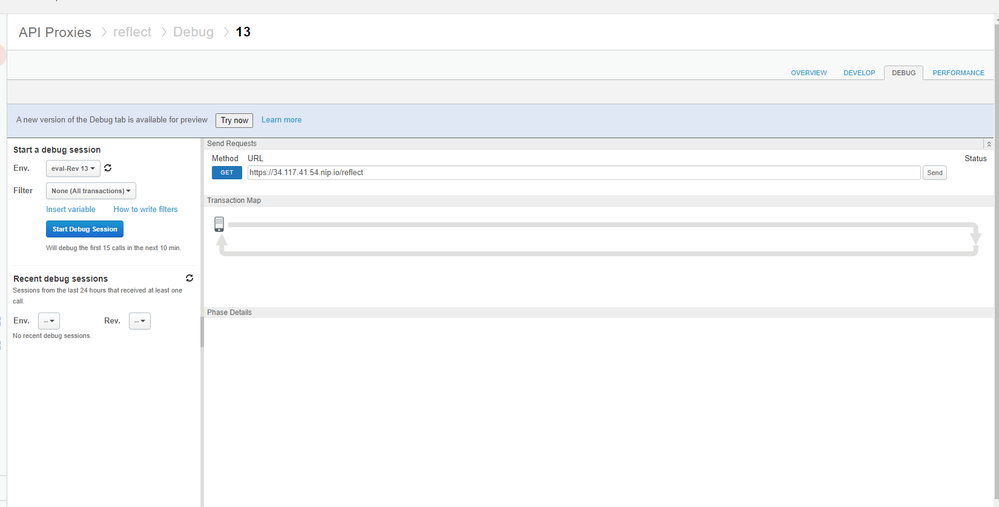
Yes, I feel your pain. It is possible to click the "start debug session" button before the API proxy is completely deployed. If you do that then there will be no debug session started. So you need to wait until the proxy is completely deployed before clicking that button. And you need to wait AFTER clicking the button, before sending requests. The team says you may have to wait 10-30 seconds. The experience you describe - "it works once in a while" - is a major hassle. I am asking the team to improve this.
I think the delay between the click of the button and when the thing is ready - might be the main cause of the behavior you're seeing. The javascript itself is not causing a problem. It's just a bug in the UI for Debug sessions.
To work around that problem, wait a little longer, until the proxy revision is completely deployed, before clicking the "start session" button. Then wait a little while (maybe 10-30 seconds) AFTER clicking the "start session" button, before trying to send in a request.
- Mark as New
- Bookmark
- Subscribe
- Mute
- Subscribe to RSS Feed
- Permalink
- Report Inappropriate Content
- Mark as New
- Bookmark
- Subscribe
- Mute
- Subscribe to RSS Feed
- Permalink
- Report Inappropriate Content
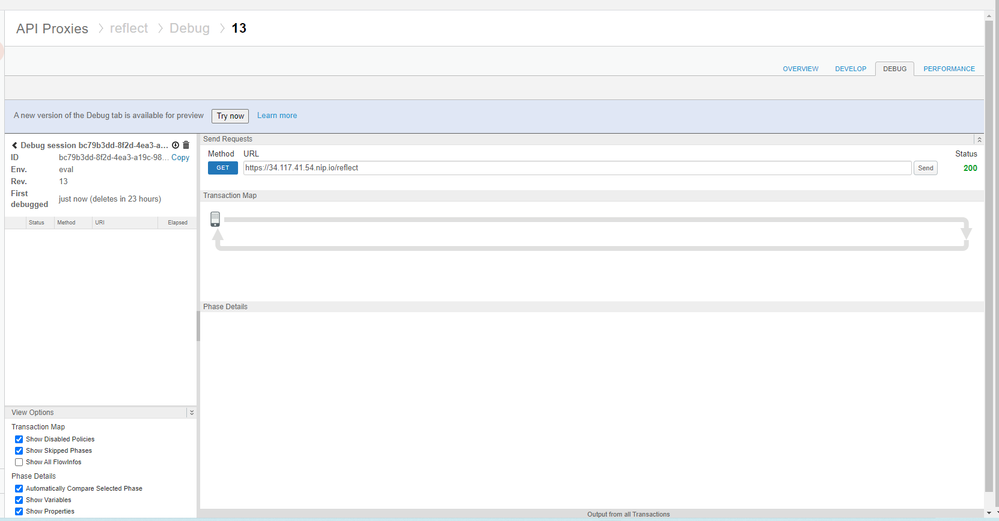
When I add a Javascript policy in APIProxy the debug /trace function stops working.
You'll need to be more specific about what you mean by "stops working". What specific buttons do you click and what do you see? Screenshots would help. a recorded screencast showing exactly what you are doing would be ideal.
- Mark as New
- Bookmark
- Subscribe
- Mute
- Subscribe to RSS Feed
- Permalink
- Report Inappropriate Content
- Mark as New
- Bookmark
- Subscribe
- Mute
- Subscribe to RSS Feed
- Permalink
- Report Inappropriate Content
The biggest problem I see in the evaluation version is that the Debug function works once in a while. Is there any restrictions on using that. Many times the Debug just remains empty.
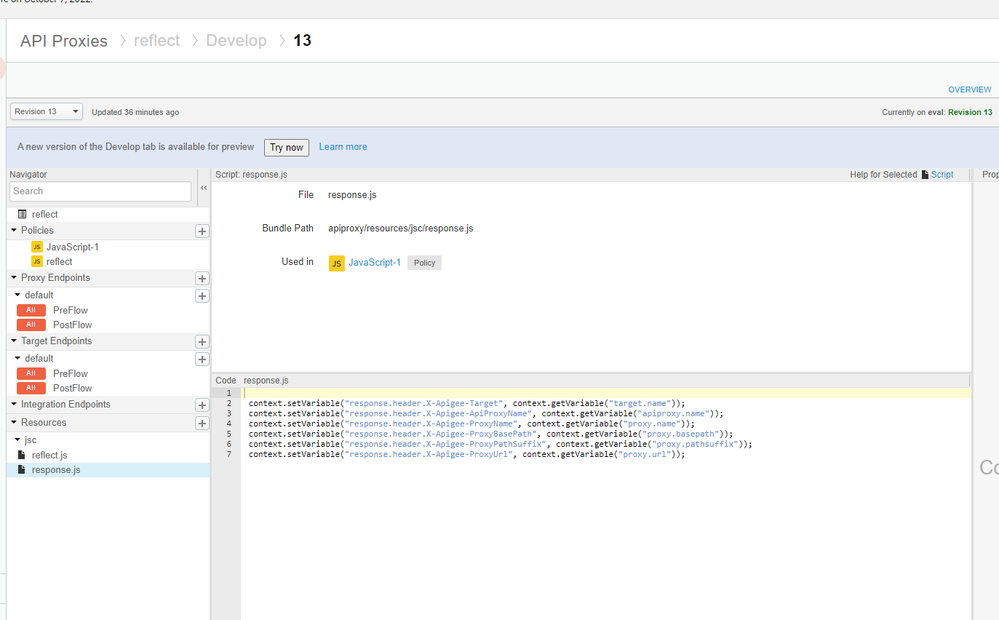
the below scripts do not seem to return the result. May I know if I am doing something wrong
context.setVariable("response.header.X-Apigee-Target", context.getVariable("target.name"));
context.setVariable("response.header.X-Apigee-ApiProxyName", context.getVariable("apiproxy.name"));
context.setVariable("response.header.X-Apigee-ProxyName", context.getVariable("proxy.name"));
context.setVariable("response.header.X-Apigee-ProxyBasePath", context.getVariable("proxy.basepath"));
context.setVariable("response.header.X-Apigee-ProxyPathSuffix", context.getVariable("proxy.pathsuffix"));
context.setVariable("response.header.X-Apigee-ProxyUrl", context.getVariable("proxy.url"));
- Mark as New
- Bookmark
- Subscribe
- Mute
- Subscribe to RSS Feed
- Permalink
- Report Inappropriate Content
- Mark as New
- Bookmark
- Subscribe
- Mute
- Subscribe to RSS Feed
- Permalink
- Report Inappropriate Content
I shared the video at https://app.castify.com/view/0022082d-0410-4ba1-9d82-078cc7ea26b5 for your quick reference.
Thank you so much for helping me sort out my learning issue.
- Mark as New
- Bookmark
- Subscribe
- Mute
- Subscribe to RSS Feed
- Permalink
- Report Inappropriate Content
- Mark as New
- Bookmark
- Subscribe
- Mute
- Subscribe to RSS Feed
- Permalink
- Report Inappropriate Content
The biggest problem I see in the evaluation version is that the Debug function works once in a while. Is there any restrictions on using that. Many times the Debug just remains empty.
Yes, I feel your pain. It is possible to click the "start debug session" button before the API proxy is completely deployed. If you do that then there will be no debug session started. So you need to wait until the proxy is completely deployed before clicking that button. And you need to wait AFTER clicking the button, before sending requests. The team says you may have to wait 10-30 seconds. The experience you describe - "it works once in a while" - is a major hassle. I am asking the team to improve this.
I think the delay between the click of the button and when the thing is ready - might be the main cause of the behavior you're seeing. The javascript itself is not causing a problem. It's just a bug in the UI for Debug sessions.
To work around that problem, wait a little longer, until the proxy revision is completely deployed, before clicking the "start session" button. Then wait a little while (maybe 10-30 seconds) AFTER clicking the "start session" button, before trying to send in a request.
-
Analytics
497 -
API Hub
75 -
API Runtime
11,665 -
API Security
178 -
Apigee General
3,041 -
Apigee X
1,288 -
Developer Portal
1,910 -
Drupal Portal
43 -
Hybrid
463 -
Integrated Developer Portal
89 -
Integration
310 -
PAYG
13 -
Private Cloud Deployment
1,069 -
User Interface
77

 Twitter
