- Google Cloud
- :
- Cloud Forums
- :
- Apigee
- :
- Re: ApigeeX- Spike Arrest policy issue in Producti...
- Subscribe to RSS Feed
- Mark Topic as New
- Mark Topic as Read
- Float this Topic for Current User
- Bookmark
- Subscribe
- Mute
- Printer Friendly Page
- Mark as New
- Bookmark
- Subscribe
- Mute
- Subscribe to RSS Feed
- Permalink
- Report Inappropriate Content
- Mark as New
- Bookmark
- Subscribe
- Mute
- Subscribe to RSS Feed
- Permalink
- Report Inappropriate Content
Hi All,
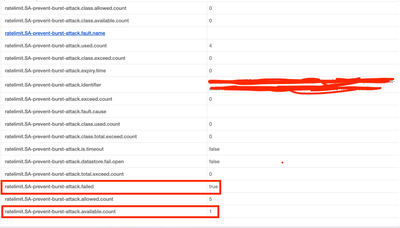
We are facing the following Spike Arrest policy issue in production. We see lots of API calls rejected due to Spike Arrest. Upon checking the Trace session, we see even though there are still counts available the call gets rejected.
The count is 5ps and its based on the identifier API Key.
Unfortunately, we are unable to simulate the same in lower environments since we don't get that volume of requests as in Production.
Can someone explain if we have missed anything ?
Any guidance will be appreciated.
Thanks
- Labels:
-
Apigee X
- Mark as New
- Bookmark
- Subscribe
- Mute
- Subscribe to RSS Feed
- Permalink
- Report Inappropriate Content
- Mark as New
- Bookmark
- Subscribe
- Mute
- Subscribe to RSS Feed
- Permalink
- Report Inappropriate Content
Can you share how the policy has been configured, some approximate total TPS and which Apigee you're using?
- Mark as New
- Bookmark
- Subscribe
- Mute
- Subscribe to RSS Feed
- Permalink
- Report Inappropriate Content
- Mark as New
- Bookmark
- Subscribe
- Mute
- Subscribe to RSS Feed
- Permalink
- Report Inappropriate Content
Hi,
The policy has the spike value and identifier which is API key.
<SpikeArrest continueOnError="false" enabled="true" name="SA-prevent-burst-attack">
<DisplayName>SA-prevent-burst-attack</DisplayName>
<Properties/>
<Rate ref="spikeVal">50ps</Rate>
<Identifier ref="client_id"/>
</SpikeArrest>
The ref value is got from App attribute which is 5ps in most of the scenarios.
We don't use "UseEffectiveCount" so it smooths the traffic.
Also we are using ApigeeX ..
Any pointers to fix this would be very helpful.
Thanks
- Mark as New
- Bookmark
- Subscribe
- Mute
- Subscribe to RSS Feed
- Permalink
- Report Inappropriate Content
- Mark as New
- Bookmark
- Subscribe
- Mute
- Subscribe to RSS Feed
- Permalink
- Report Inappropriate Content
How many / how often do you get requests from the same API Consumer? One thing to note is having a rate of 5 requests per second, is effectively 1 request every 200ms, rather than 5 requests per second.. it's a subtle but important difference.
- Mark as New
- Bookmark
- Subscribe
- Mute
- Subscribe to RSS Feed
- Permalink
- Report Inappropriate Content
- Mark as New
- Bookmark
- Subscribe
- Mute
- Subscribe to RSS Feed
- Permalink
- Report Inappropriate Content
This API is heavily used in production. We had to revert back from production due to high volume of requests being rejected by Spike Arrest Policy.
But seeing the log for few hrs we had in Production, there was 287 calls/hr for this API for a specific API Key( for 1 customer alone). Moreover this is not during the peak period since the production move was done during non-peak hrs.
Regarding the spike values ,Yes , you are perfectly right. 5ps is 1 request every 200 ms.But we are not sure how this is executed . The trace values are misleading - it says we have count available but the call gets rejected. Moreover in Production, we couldn't debug for long to get enough data.
How do we know that this is executed properly in order for us to update the Spike value to a more appropriate one?
Note: This API is being migrated from another API system to ApigeeX . We had 5ps in earlier system and didn't face this issue there. We are fine to modify the value but not sure how to validate if this policy is executing correctly.
Thanks
- Mark as New
- Bookmark
- Subscribe
- Mute
- Subscribe to RSS Feed
- Permalink
- Report Inappropriate Content
- Mark as New
- Bookmark
- Subscribe
- Mute
- Subscribe to RSS Feed
- Permalink
- Report Inappropriate Content
Hi @dknezic ,
I did some analysis of the Trace calls that we had the issue with. We log the entries in the Cloud Logging in the PostClientFlow . Upon analysing the Client Received Start TimeStamp of these entries , it looks like the spike was executed correctly. In 200ms if there is more than 1 call, the spike has been invoked.
But we see different data in the Trace. Why is that so?
What is the correct way to check this policy ?
Thanks
-
Analytics
497 -
API Hub
75 -
API Runtime
11,665 -
API Security
178 -
Apigee General
3,041 -
Apigee X
1,288 -
Developer Portal
1,910 -
Drupal Portal
43 -
Hybrid
463 -
Integrated Developer Portal
89 -
Integration
310 -
PAYG
13 -
Private Cloud Deployment
1,069 -
User Interface
77

 Twitter