This website uses Cookies. Click Accept to agree to our website's cookie use as described in our Privacy Policy. Click Preferences to customize your cookie settings.
Turn on suggestions
Auto-suggest helps you quickly narrow down your search results by suggesting possible matches as you type.
Showing results for
- Google Cloud
- Articles & Information
- Cloud Product Articles
- Log messages into Splunk
Topic Options
- Subscribe to RSS Feed
- Mark as New
- Mark as Read
- Bookmark
- Subscribe
- Printer Friendly Page
- Report Inappropriate Content

 LinkedIn
 Twitter
sarthak
New Member
Topic Options
- Article History
- Subscribe to RSS Feed
- Mark as New
- Mark as Read
- Bookmark
- Subscribe
- Printer Friendly Page
- Report Inappropriate Content
10
12
31.5K
Logging into an external logging system is a very common requirement for EDGE platform and one of the most common systems we need to log to is splunk.
There are multiple ways of logging into Splunk. Below are described a few ways to log:
For trying out this I installed Splunk enterprise on-prem.
1. Log over HTTP
As a step 1 we first configure HTTP Event Collector in Splunk. I did that following the tutorial here:
http://dev.splunk.com/view/event-collector/SP-CAAAE7F
Once you finish this then Splunk will be listening on port 8088 by default for incoming requests over HTTP/s
Then create a Service callout policy with a configuration like below to send logs over HTTP/s event Collector.
<ServiceCallout name="Log-to-Splunk">
<DisplayName>Log to Splunk</DisplayName>
<Properties/>
<Request clearPayload="true" variable="myRequest">
<IgnoreUnresolvedVariables>false</IgnoreUnresolvedVariables>
<Set>
<Headers>
<Header name="Authorization">Splunk PUT-SPLUNK-CODE_HERE</Header>
</Headers>
<Payload contentType="application/json">
{"event":"Logged from EDGE"}
</Payload>
<Path>services/collector/event</Path>
<Verb>POST</Verb>
</Set>
</Request>
<Response>calloutResponse</Response>
<HTTPTargetConnection>
<Properties/>
<URL>https://52.23.227.40:8088/</URL>
</HTTPTargetConnection>
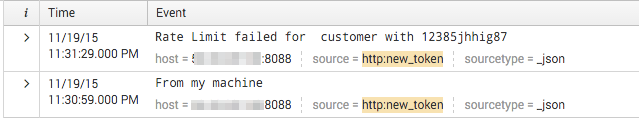
</ServiceCallout>The logs appear like below in Splunk:

2. Log over TCP
The other option is to log via TCP or UDP using Message Logging Policy.
Both Apigee and splunk supports both the protocols. But Splunk recommends TCP, hence we will use that.
The policy will look like this:
<MessageLogging name="Log-to-splunk-over-TCP">
    <DisplayName>Log to splunk over TCP</DisplayName>
    <Syslog>
        <Message>Message = "Something happened and I am logging via TCP"</Message>
        <Host>XX.XX.XX.XX</Host>
        <Port>2900</Port>
        <Protocol>TCP</Protocol>
    <SSLInfo>
        <Enabled>true</Enabled>
    </SSLInfo>
    </Syslog>
</MessageLogging>
3. Log via javascript
You will also be able to log to splunk via javascript or node.js. You can find corresponding tutorials here: http://dev.splunk.com/view/javascript-sdk/SP-CAAAEC9
4. As @gbhandari points out there is one more option for logging into Splunk. But this is only applicable for Apigee on-prem (private cloud) customers.
You can use the message logging policy to log messages to local file system.Check here: http://docs.apigee.com/api-services/reference/message-logging-policy#location. You can install Splunk agents on those instances. Each Splunk agent can forward the messages logged to the Splunk server.
Topic Labels
Comments
akoo
New Member
- Mark as Read
- Mark as New
- Bookmark
- Permalink
- Report Inappropriate Content
03-29-2016
04:26 PM
+1'd. And if async JS calls are the soup du jour, great post on doing that in Apigee Edge here: https://community.apigee.com/articles/2340/asynchronous-http-requests-in-an-api-proxy.html
gaurav_bhandari
New Member
- Mark as Read
- Mark as New
- Bookmark
- Permalink
- Report Inappropriate Content
03-30-2016
03:47 AM
Hi Sarthak,
There is one more way.
One can also install splunk on all the servers. And in the splunk configuration files, you can provide the important log details like system-monitor.logs, system.logs, Message Logging Policy logs, etc log paths and those log files will be forwarded to splunk.
sarthak
New Member
- Mark as Read
- Mark as New
- Bookmark
- Permalink
- Report Inappropriate Content
04-01-2016
10:24 AM
Hi @gbhandari Yes, thanks that is a good suggestion. But it is only applicable for on-prem customers. I will update my article with this.
Not applicable
- Mark as Read
- Mark as New
- Bookmark
- Permalink
- Report Inappropriate Content
04-04-2016
02:30 PM
If SSLInfo = enabled in messaging policy, how to specify which trustore to use in this Policy ?
DChiesa
Staff
- Mark as Read
- Mark as New
- Bookmark
- Permalink
- Report Inappropriate Content
02-28-2017
09:40 AM
You would do that in the same way you configure TrustStore for any SSL-enabled target in Apigee Edge.
<SSLInfo>
      <Enabled>true</Enabled>
      <TrustStore>myTrustStore</TrustStore>
</SSLInfo>
DChiesa
Staff
- Mark as Read
- Mark as New
- Bookmark
- Permalink
- Report Inappropriate Content
02-28-2017
09:42 AM
The benefit of using JavaScript callout via the httpClient is that you can make it fire-and-forget. You do not need to wait for the response. See here for a relevant Q&A.
kkleva
New Member
- Mark as Read
- Mark as New
- Bookmark
- Permalink
- Report Inappropriate Content
02-28-2017
09:45 AM
MessageLogging policies appear to perform the best in my testing so it's the approach I've recommended here a few times. Especially if you want to be logging multiple times in a request (e.g. Request, Response and any Faults) .
I would not recommend doing it in JavaScript or Node.js unless you do not have any other alternative. I've tried this myself and run into performance issues at high loads.
Finally, don't forget about the PostClientFlow for logging timings after the response has been delivered to the client.
    <PostClientFlow>
      <Request/>
      <Response>
          <Step>
              <Name>Message-Logging-Response</Name>
          </Step>
      </Response>
    </PostClientFlow>
arunprasath25

Bronze 5
- Mark as Read
- Mark as New
- Bookmark
- Permalink
- Report Inappropriate Content
12-17-2018
07:48 AM
while logging over TCP, where can i find the value of <Host> tag. FYI: i am using trail version of both splunk and apigee
antoshojan
New Member
- Mark as Read
- Mark as New
- Bookmark
- Permalink
- Report Inappropriate Content
01-22-2019
09:47 PM
<?xml version="1.0" encoding="UTF-8" standalone="yes"?> <MessageLogging async="false" continueOnError="false" enabled="true" name="Log-to-splunk-over-TCP"> <DisplayName>Log to splunk over TCP</DisplayName> <Syslog> <Message>Message = "Something happened and I am logging via TCP"</Message> <Host>xxx.xxx.com</Host> <Port>xxxx</Port> <Protocol>TCP</Protocol> <SSLInfo> <Enabled>true</Enabled> <clientAuthEnabled>true</clientAuthEnabled> <keyAlias>xxxxx</keyAlias> <keyStore>ref://xxxkeystoreref</keyStore> <TrustStore>ref://xxxtruststoreref</TrustStore> <protocols>TLSv1.2</protocols> </SSLInfo> </Syslog> </MessageLogging>
antoshojan
New Member
- Mark as Read
- Mark as New
- Bookmark
- Permalink
- Report Inappropriate Content
01-22-2019
09:48 PM
Is this syntax correct. Though i give any dummy parameter, the message logging policy is not failing.
antoshojan
New Member
- Mark as Read
- Mark as New
- Bookmark
- Permalink
- Report Inappropriate Content
01-22-2019
09:50 PM
Log to splunk over TCP
Message = "Something happened and I am logging via TCP"
xxx.xxx.com
xxxx
TCP
true
true
xxxxxxx
ref://xxxxkeystoreref
ref://xxxtruststoreref
TLSv1.2
avdheshchouhan-
New Member
- Mark as Read
- Mark as New
- Bookmark
- Permalink
- Report Inappropriate Content
04-15-2020
10:40 AM
I am facing the same issue . From last 4 hours I am trying to locate host name in splunk for TCP ... It should be easy to find.