This website uses Cookies. Click Accept to agree to our website's cookie use as described in our Privacy Policy. Click Preferences to customize your cookie settings.
Turn on suggestions
Auto-suggest helps you quickly narrow down your search results by suggesting possible matches as you type.
Showing results for
- Google Cloud
- Articles & Information
- Cloud Product Articles
- Enriching Envoy Access Logs with Custom Data for A...
Topic Options
- Subscribe to RSS Feed
- Mark as New
- Mark as Read
- Bookmark
- Subscribe
- Printer Friendly Page
- Report Inappropriate Content

 LinkedIn
 Twitter
joel_gauci
Staff
Topic Options
- Article History
- Subscribe to RSS Feed
- Mark as New
- Mark as Read
- Bookmark
- Subscribe
- Printer Friendly Page
- Report Inappropriate Content
4
1
5,402
Introduction
Customization of access logs is an option often considered by Apigee customers when data specific to their API program must be traced on each API call.
This community article describes the different options for access logging in Apigee hybrid and presents solutions to customize access logs based on Envoy filters (EnvoyFilter) and dynamic metadata.
Access Logs in a few words...
In the context of an API program and Apigee, an access log is a list of all requests for individual APIs that client applications or bots have requested.
An access log gathers various information such as:
- Timestamp
- HTTP method used
- HTTP status code
- requested API (base path, URI ...)
- user agent of the client application
- client IP address
- hostname,
- ...
As an access log example, here you can find the default format string that is configured for an Envoy proxy.
Access logs data are important for Apigee customers and must often be enriched with some other API product-related information, only known by the Apigee runtime.
In many cases, access logs are used for audit, disaster recovery and machine learning algorithms to cover different needs.
Options for access logging in Apigee hybrid
This section introduces the main access log options available when using Apigee hybrid.
The 4 options selected and detailed in this article are:
- MessageLogging/ServiceCallout policies
- Native envoy/Apigee hybrid access logs
- Apigee dynamic data
- EnvoyFilter mechanism
MessageLogging/ServiceCallout Policies
The MessageLogging policy is part of the extension policies available in Apigee hybrid, as shown on the following picture:
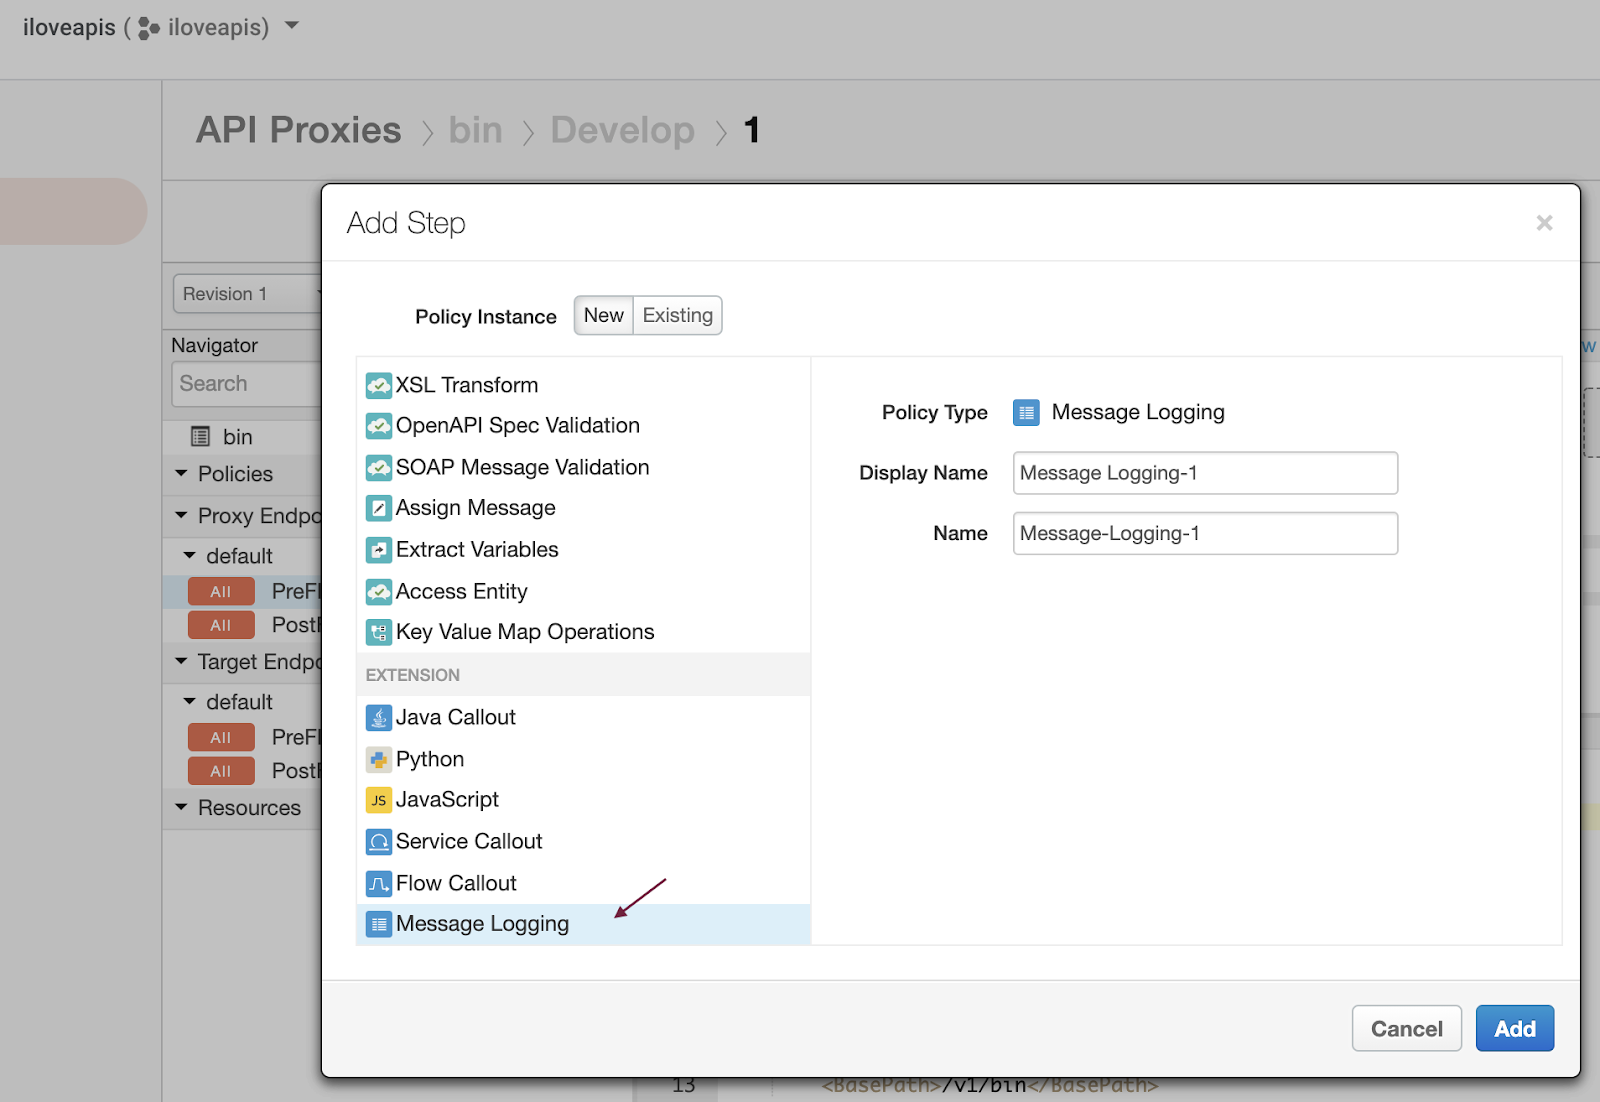
By attaching a MessageLogging policy to an API Proxy in the ProxyEndpoint response and in a PostClientFlow, it is possible to create an access log - enriched with some specific data - that can be asynchronously sent to a third-party syslog service like Splunk or Loggly.
The enrichment of the data to be logged can be carried out via the extraction of data present in the API traffic (query parameter, header, URI, payload...) or at the level of the Apigee runtime, like Key Management System (KMS) data (companies, developers, developer apps, API products…).
An alternative to the MessageLogging policy is the use of the ServiceCallout policy which can also be configured in a PostClientFlow.
Using a ServiceCallout policy is a valuable option in Apigee hybrid when you need to log data to Google Cloud Logging.
Native Envoy/Apigee hybrid access logs
Apigee hybrid is an API Management platform that features a hybrid deployment model. The hybrid model includes a management plane hosted by Apigee in the Cloud and a runtime plane that you install and manage on one of the supported Kubernetes platforms.
The Apigee hybrid runtime uses the Istio distribution provided with Anthos Service Mesh (ASM).
More specifically, Apigee hybrid uses ASM for ingress capabilities and all access logs are recorded by the Envoy proxy acting as an ingress gateway for the hybrid runtime.
Since Apigee hybrid 1.3, the native ASM configuration (istio-operator.yaml) must be updated during the installation process, with Apigee hybrid settings as described here.
These settings contain the definition of an access log format and encoding (JSON) for Apigee access logs. These access logs are directed to the standard output (/dev/stdout) - as shown here:
...

accessLogFile: "/dev/stdout"
	accessLogEncoding: 1
# This is Apigee's custom access log format. Changes should not be made to this
# unless first working with the Data and AX teams as they parse these logs for
# SLOs.

	accessLogFormat: '{"start_time":"%START_TIME%","remote_address":"%DOWNSTREAM_DIRECT_REMOTE_ADDRESS%","user_agent":"%REQ(USER-AGENT)%","host":"%REQ(:AUTHORITY)%","request":"%REQ(:METHOD)% %REQ(X-ENVOY-ORIGINAL-PATH?:PATH)% %PROTOCOL%","request_time":"%DURATION%","status":"%RESPONSE_CODE%","status_details":"%RESPONSE_CODE_DETAILS%","bytes_received":"%BYTES_RECEIVED%","bytes_sent":"%BYTES_SENT%","upstream_address":"%UPSTREAM_HOST%","upstream_response_flags":"%RESPONSE_FLAGS%","upstream_response_time":"%RESPONSE_DURATION%","upstream_service_time":"%RESP(X-ENVOY-UPSTREAM-SERVICE-TIME)%","upstream_cluster":"%UPSTREAM_CLUSTER%","x_forwarded_for":"%REQ(X-FORWARDED-FOR)%","request_method":"%REQ(:METHOD)%","request_path":"%REQ(X-ENVOY-ORIGINAL-PATH?:PATH)%","request_protocol":"%PROTOCOL%","tls_protocol":"%DOWNSTREAM_TLS_VERSION%","request_id":"%REQ(X-REQUEST-ID)%","sni_host":"%REQUESTED_SERVER_NAME%","apigee_dynamic_data":"%DYNAMIC_METADATA(envoy.lua)%"}'

...
The data logged in Apigee access logs are presented here, using Envoy command operators.
Command operators are used to extract values that are inserted into the access logs:
- %START_TIME%: start time
- %DOWNSTREAM_DIRECT_REMOTE_ADDRESS%: remote address
- %REQ(USER-AGENT)%: user agent request header value
- %REQ(:AUTHORITY)%; authority request header value
- %REQ(:METHOD)%: HTTP method
- %REQ(X-ENVOY-ORIGINAL-PATH?:PATH)%: X-ENVOY-ORIGINAL-PATH request header value
- %PROTOCOL%: HTTP Protocol
- %DURATION%: request time
- %RESPONSE_CODE%: HTTP status code
- %RESPONSE_CODE_DETAILS%: HTTP status details
- %BYTES_RECEIVED%: bytes received
- %BYTES_SENT%: bytes sent
- %UPSTREAM_HOST%: upstream address
- %RESPONSE_FLAGS%: response flags
- %RESPONSE_DURATION%: response duration
- %RESP(X-ENVOY-UPSTREAM-SERVICE-TIME)%: X-ENVOY-UPSTREAM-SERVICE-TIME response header value
- %UPSTREAM_CLUSTER%: upstream cluster
- %REQ(X-FORWARDED-FOR)%: client IP address (X-FORWARDED-FOR request header value)
- %DOWNSTREAM_TLS_VERSION%: TLS protocol
- %REQ(X-REQUEST-ID)%: X-REQUEST-ID request header value
- %REQUESTED_SERVER_NAME%: SNI host
- %DYNAMIC_METADATA(envoy.lua)%: Apigee dynamic metadata
For a detailed description of Envoy command operators, please refer to the Envoy documentation.
In particular, the DYNAMIC_METADATA directive can be used to log data as a JSON string. It is a very interesting option to enrich access logs and we explore it in the next chapter.
Warning
So why not add a shared flow/policies on Apigee that would extract data from my API traffic and inject those same data as response headers? If at the same time I declare those response headers in the ASM ingress settings (access log format) then we are good?!...
In fact, if you pay attention to the Apigee hybrid settings that must be included into the ASM configuration (istio-operator.yaml), you will notice the following warning:
# This is Apigee's custom access log format. Changes should not be made to this
# unless first working with the Data and AX teams as they parse these logs for
# SLOs.
The message is clear: you SHOULD NOT modify this content.
Indeed, the temptation is great to directly modify this content to insert data specific to your API traffic, but it is absolutely not recommended to do so.
We will present the best option to configure a new access log on Istio/ASM in the next chapters but let’s see first how to observe Envoy access logs of Apigee hybrid runtime through some basic command lines and also from Google Cloud Operations.
How to access Envoy access logs of Apigee hybrid runtime?
If necessary, set the current context to your hybrid runtime cluster (the cluster into which you intend to get Envoy access logs)
In order to access Envoy access logs, you need first to get the name of the Istio ingress gateway pods:
$ kubectl get pod -l app=istio-ingressgateway -n istio-system
As a response, you will get one or a list of istio ingress gateway pod names.
Let’s export this value (or one of the values) into an environment variable (IIGW_POD: Istio Ingress Gateway Pod):
$ export IIGW_POD=$(kubectl get pod -l app=istio-ingressgateway -o custom-columns=:metadata.name -n istio-system)
If there are several values, choose the ingress gateway pod for which you want to see access logs and export it to the IIGW_POD environment variable.
Let’s start Envoy log in tail mode:
$ kubectl logs -n istio-system $IIGW_POD -f
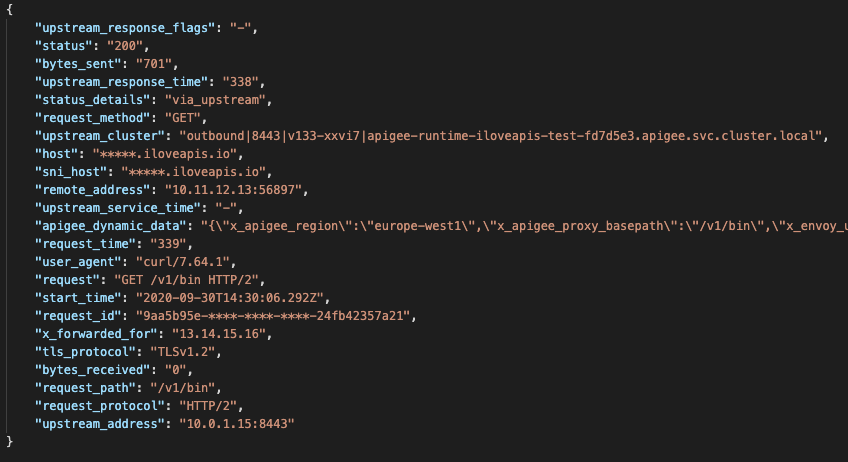
Using an HTTP client, send some requests on one of the APIs exposed on your Apigee hybrid runtime. You should see access log records on the Envoy log output.
Here is an example of such a log record.
For more clarity, the JSON content has been formatted and is provided as an image. Sensitive data have also been anonymized:
Envoy Access Logs in Google Cloud Operations
Envoy access logs can also be seen in Operations (formerly known as StackDriver).
If you want to see Envoy Access logs in Operations/Cloud Logging, first connect to your Google Cloud Platform (GCP) console and select: Operations → Logging → Logs Viewer, as shown here:

Then using the query builder, select the Kubernetes container for which you want to get logs.
The container name is istio-proxy, available on the istio-system namespace in your hybrid runtime cluster (hybrid-132-cluster1 in this example):
Query

Once the query has been built, just execute it, clicking the Run Query button:

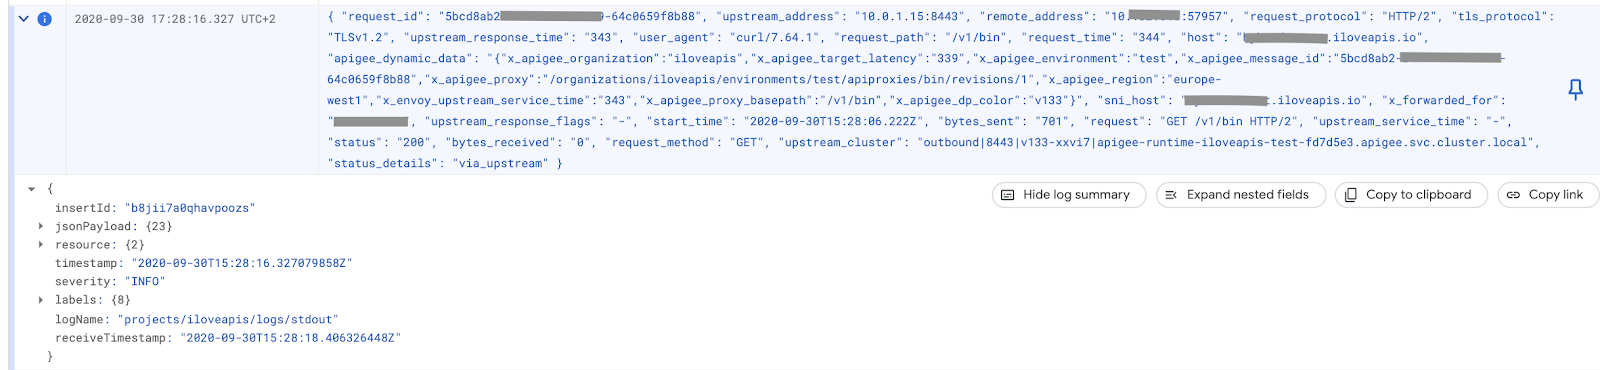
Envoy access logs are then displayed, as shown below:
Apigee dynamic metadata
Coming back on the previous access log example you can see that in addition to the Envoy specific metrics, Apigee dynamic metadata (see “apigee_dynamic_data” in the JSON payload) are also inserted into Envoy access logs.
Before considering log enrichment, check if the information present in the dynamic metadata meets your needs or not.
Here is an example of Apigee dynamic metadata extracted from a log record.
For more clarity, the JSON content has been formatted and is provided as an image.
Sensitive data have also been anonymized in the example:

This content is created by a dedicated Apigee EnvoyFilter (apigee-envoyfilter), whose aim is to sanitize headers.
In particular, all response headers starting with “x-apigee-” (and “x-envoy-”) are removed from the response that is sent back to client applications. In parallel, these response headers are set into the Apigee dynamic data content.
This means that if you want to set specific data into the default Apigee hybrid access logs, a basic and simple solution is to set these data as response headers (from an API Proxy or shared flow) with a name starting with “x-apigee-”.
On the one hand these response headers will not be propagated to client applications on the response and on the other hand they will appear in the access logs as part of the JSON content of the apigee_dynamic_data key.
You can get the details of the Apigee EnvoyFilter (apigee-envoyfilter) using the following command:
$ kubectl describe EnvoyFilter apigee-envoyfilter -n istio-system
Below is an extract of this EnvoyFilter, emphasizing the part of the Lua filter that, in order:
- normalizes the header names starting with “x-apigee” and “x-envoy”,
- injects normalized data into Apigee dynamic data,
- removes response headers starting with “x-apigee” and “x-envoy”
...-- Sanitize and remove any x-apigee and x-envoy headers from responses.

function envoy_on_response(response_handle)
 toremove = {}
 for k, v in pairs(response_handle:headers()) do
  lowerkey = string.lower(k)
  if string.find(lowerkey, "x-apigee") ~= nil or string.find(lowerkey, "x-envoy") ~= nil then
   normalized_key = string.gsub(string.gsub(lowerkey, "%.", "_"), "%-", "_")
   response_handle:streamInfo():dynamicMetadata():set("envoy.lua",normalized_key,v)
   toremove[k] = ""
  end
 end
 for k,v in pairs(toremove) do
  response_handle:headers():remove(k)
 end
end

...
Practical example of Apigee hybrid dynamic metadata
Here is a practical example showing how to use Apigee dynamic metadata in the context of Apigee hybrid.
First, let’s consider that we want to add two entries into the Apigee dynamic metadata set:
- The name of the current API Product
- The name of the client application
These two entries are only known from the Apigee platform.
Therefore we need to add a set of security and mediation policies, in an Apigee API Proxy or Shared Flow that is able to:
- Verify the API Key that is transmitted by the client application (it is a best practice to require such a key)
- Get the name of the client application, as defined in Apigee
- Get the name of the related API Product
- Set the 2 data into dedicated response headers
This Apigee configuration can be implemented using an API Key Verification policy and an Assign Message policy.
The Assign Message policy can set response headers and use general flow variables populated by the Verify API Key policy. These flow variables are presented in the Apigee docs.
As we do not want to return these values to the client application, we can choose response header names starting with the “x-apigee-” prefix.
In our example we choose the following values:
- x-apigee-api-product: to set the name of the API Product
- x-apigee-client-app: to set the name of the client application
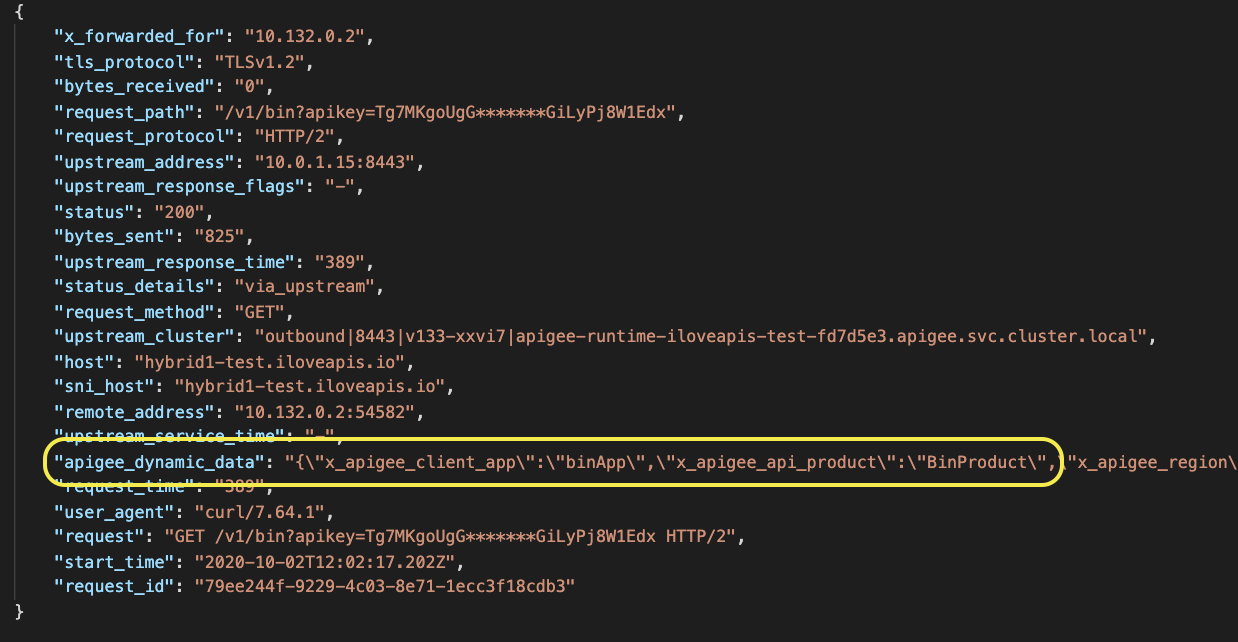
When executing a request, the 2 response headers are populated from an Apigee Message Processor/API Proxy and set into Apigee dynamic metadata by the Apigee EnvoyFilter.
Here is an example of such an access log record presenting the 2 data, through the value (JSON string) of the "apigee_dynamic_data" key:
EnvoyFilter mechanism
The last option we can consider to customize access logs is based on EnvoyFilter.
EnvoyFilter provides a standard mechanism to customize the Envoy configuration generated by Istio Pilot.
The Istio documentation presents EnvoyFilter in detail. So please take time to read this doc if you want to understand the benefits of EnvoyFilter in the context of Apigee hybrid.
EnvoyFilters are the best and easiest option to consider if:
- you want to enrich/customize Envoy Access logs without modifying the Apigee settings through the Istio operator
- you want to send the access log to an external logging solution, using gRPC for instance
In the next chapter we detail the usage of such a filter in the context of access log enrichment, through a detailed example.
How to create custom access logs using EnvoyFilter?
This chapter describes how to create custom access logs in Apigee hybrid using the EnvoyFilter mechanism.
You can find EnvoyFilter samples on the official Istio wiki
Here is a simple example of a file access log configuration based on EnvoyFilter (customEnvoyFilter.yaml):
apiVersion: networking.istio.io/v1alpha3
kind: EnvoyFilter
metadata:
 name: custom-accesslog
 namespace: istio-system
spec:
 configPatches:
 - applyTo: NETWORK_FILTER
   match:
    context: GATEWAY
    listener:
     filterChain:
      filter:
       name: "envoy.http_connection_manager"
   patch:
    operation: MERGE
    value:
     config:
      access_log:
       - name: envoy.file_access_log
         typed_config:
          "@type": "type.googleapis.com/envoy.config.accesslog.v2.FileAccessLog"
          path: /dev/stdout
          jsonFormat:
           request: "%REQ(:METHOD)% %REQ(X-ENVOY-ORIGINAL-PATH?:PATH)% %PROTOCOL%"
           clientapp: "%RESP(X-CLIENT-APP)%"
           apiproduct: "%RESP(X-API-PRODUCT)%"
Here are some explanations about this EnvoyFilter:
- metadata.name: the name of the EnvoyFilter is custom-accesslog
- metadata.namespace: the namespace of the filter is istio-system. We need to use this namespace as we want to apply the EnvoyFilter to the Istio ingress gateway of an Apigee hybrid runtime that is specifically set on this same namespace
- spec.configPatches[].applyTo: NETWORK_FILTER is used to apply the patch to the network filter chain, to modify an existing filter or add a new filter. In this example, changes to be made to the network filter named “envoy.http_connection_manager”
- spec.configPatches[].match.context: GATEWAY means that the configuration only applies to gateway listener/route/cluster
- spec.configPatches[].patch: this defines the patch to apply along with the operation (MERGE)
- spec.configPatches[].patch.operation: MERGE; Merge the provided config with the generated config using json merge semantics
- spec.configPatches[].patch.value: the JSON config of the object being patched
In the patch value, a file access log is defined: the JSON format specifies the format of the log, based on a JSON encoding.
As an example, this access log contains information about the request ("%REQ(:METHOD)% %REQ(X-ENVOY-ORIGINAL-PATH?:PATH)% %PROTOCOL%") as well as 2 Apigee data:
- The name of the client application
- The name of the API Product that is consumed
These 2 data are retrieved by the EnvoyFilter, respectively from the 2 following HTTP response headers:
- X-CLIENT-APP
- X-API-PRODUCT
You can use the istioctl (Istio configuration command line utility) to validate your EnvoyFilter definition:
$ istioctl validate -f customEnvoyFilter.yaml
If the EnvoyFilter is valid you will see the following message:
"customEnvoyFilter.yaml" is valid
In order to create the EnvoyFilter, just apply its configuration on your Apigee hybrid cluster, on the istio-system namespace (istio-system is the namespace used by the Istio ingress gateway):
$ kubectl apply -f customEnvoyFilter.yaml -n istio-system
Here is a command to check the creation of the custom access log from the Istio ingress gateway listener configuration:
$ istioctl proxy-config listener $IIGW_POD --port 443 -n istio-system -o json | less
In the extract of the response below, you can see that the configuration includes 2 file access logs. The second one is the one we have just created:

How to configure data to be traced in a Custom access log?
As you can see in the previous picture, command operators are used to extract values from request and response headers.
The 2 command operators used to extract request and response headers are:
- %REQ(X?Y):Z% : an HTTP request header where X is the main HTTP header, Y is the alternative one, and Z is an optional parameter denoting string truncation up to Z characters long. The value is taken from the HTTP request header named X first and if it’s not set, then request header Y is used. If none of the headers are present ‘-‘ symbol will be in the log
- %RESP(X?Y):Z% : same as %REQ(X?Y):Z% but taken from HTTP response headers
Using the envoy directive DYNAMIC_METADATA, it is also possible to automatically set - as a JSON string - all the response headers prefixed by “x-apigee-” or “x-envoy-”. In the same time, all these response headers are removed from the HTTP response that is sent back to the client application.
The removal of headers will not be automatically executed if the response headers do not start with either “x-apigee-” or “x-envoy-”. In our previous example, the 2 response headers “x-api-product” and “x-client-app” are logged but also returned to the client application, which might not be your goal...
Conclusion
Putting it all together, this chapter presents different options that can be used to define custom access logs when using Apigee hybrid 1.3+.
The best option to consider is the use of dynamic metadata and the Apigee EnvoyFilter.
As we have seen, all “x-apigee-” response headers are logged into access logs (custom or default) and removed from the HTTP response.
Nevertheless, creating a custom EnvoyFilter for access logs in the context of Apigee can be interesting if you want to define a log target that is accessible through gRPC. But remember that even in this situation Apigee dynamic metadata can be accessed.
It is also important to consider solutions which favor the use of extension mechanisms rather than those modifying the standard configurations, and which are subject to modification when the Apigee hybrid offer evolves.
Therefore, do not modify the Apigee settings as they may change in future releases of Apigee hybrid.
Topic Labels
Comments
mdunker
Staff
- Mark as Read
- Mark as New
- Bookmark
- Permalink
- Report Inappropriate Content
10-07-2020
12:29 PM
Nice article, @joel gauci!