This website uses Cookies. Click Accept to agree to our website's cookie use as described in our Privacy Policy. Click Preferences to customize your cookie settings.
Turn on suggestions
Auto-suggest helps you quickly narrow down your search results by suggesting possible matches as you type.
Showing results for
- Google Cloud
- Articles & Information
- Cloud Product Articles
- Developer Portal - App Analytics - Improved UX wit...
Topic Options
- Subscribe to RSS Feed
- Mark as New
- Mark as Read
- Bookmark
- Subscribe
- Printer Friendly Page
- Report Inappropriate Content

 LinkedIn
 Twitter
anilsr
Staff
Topic Options
- Article History
- Subscribe to RSS Feed
- Mark as New
- Mark as Read
- Bookmark
- Subscribe
- Printer Friendly Page
- Report Inappropriate Content
3
7
1,548
Hello Apigeeks,
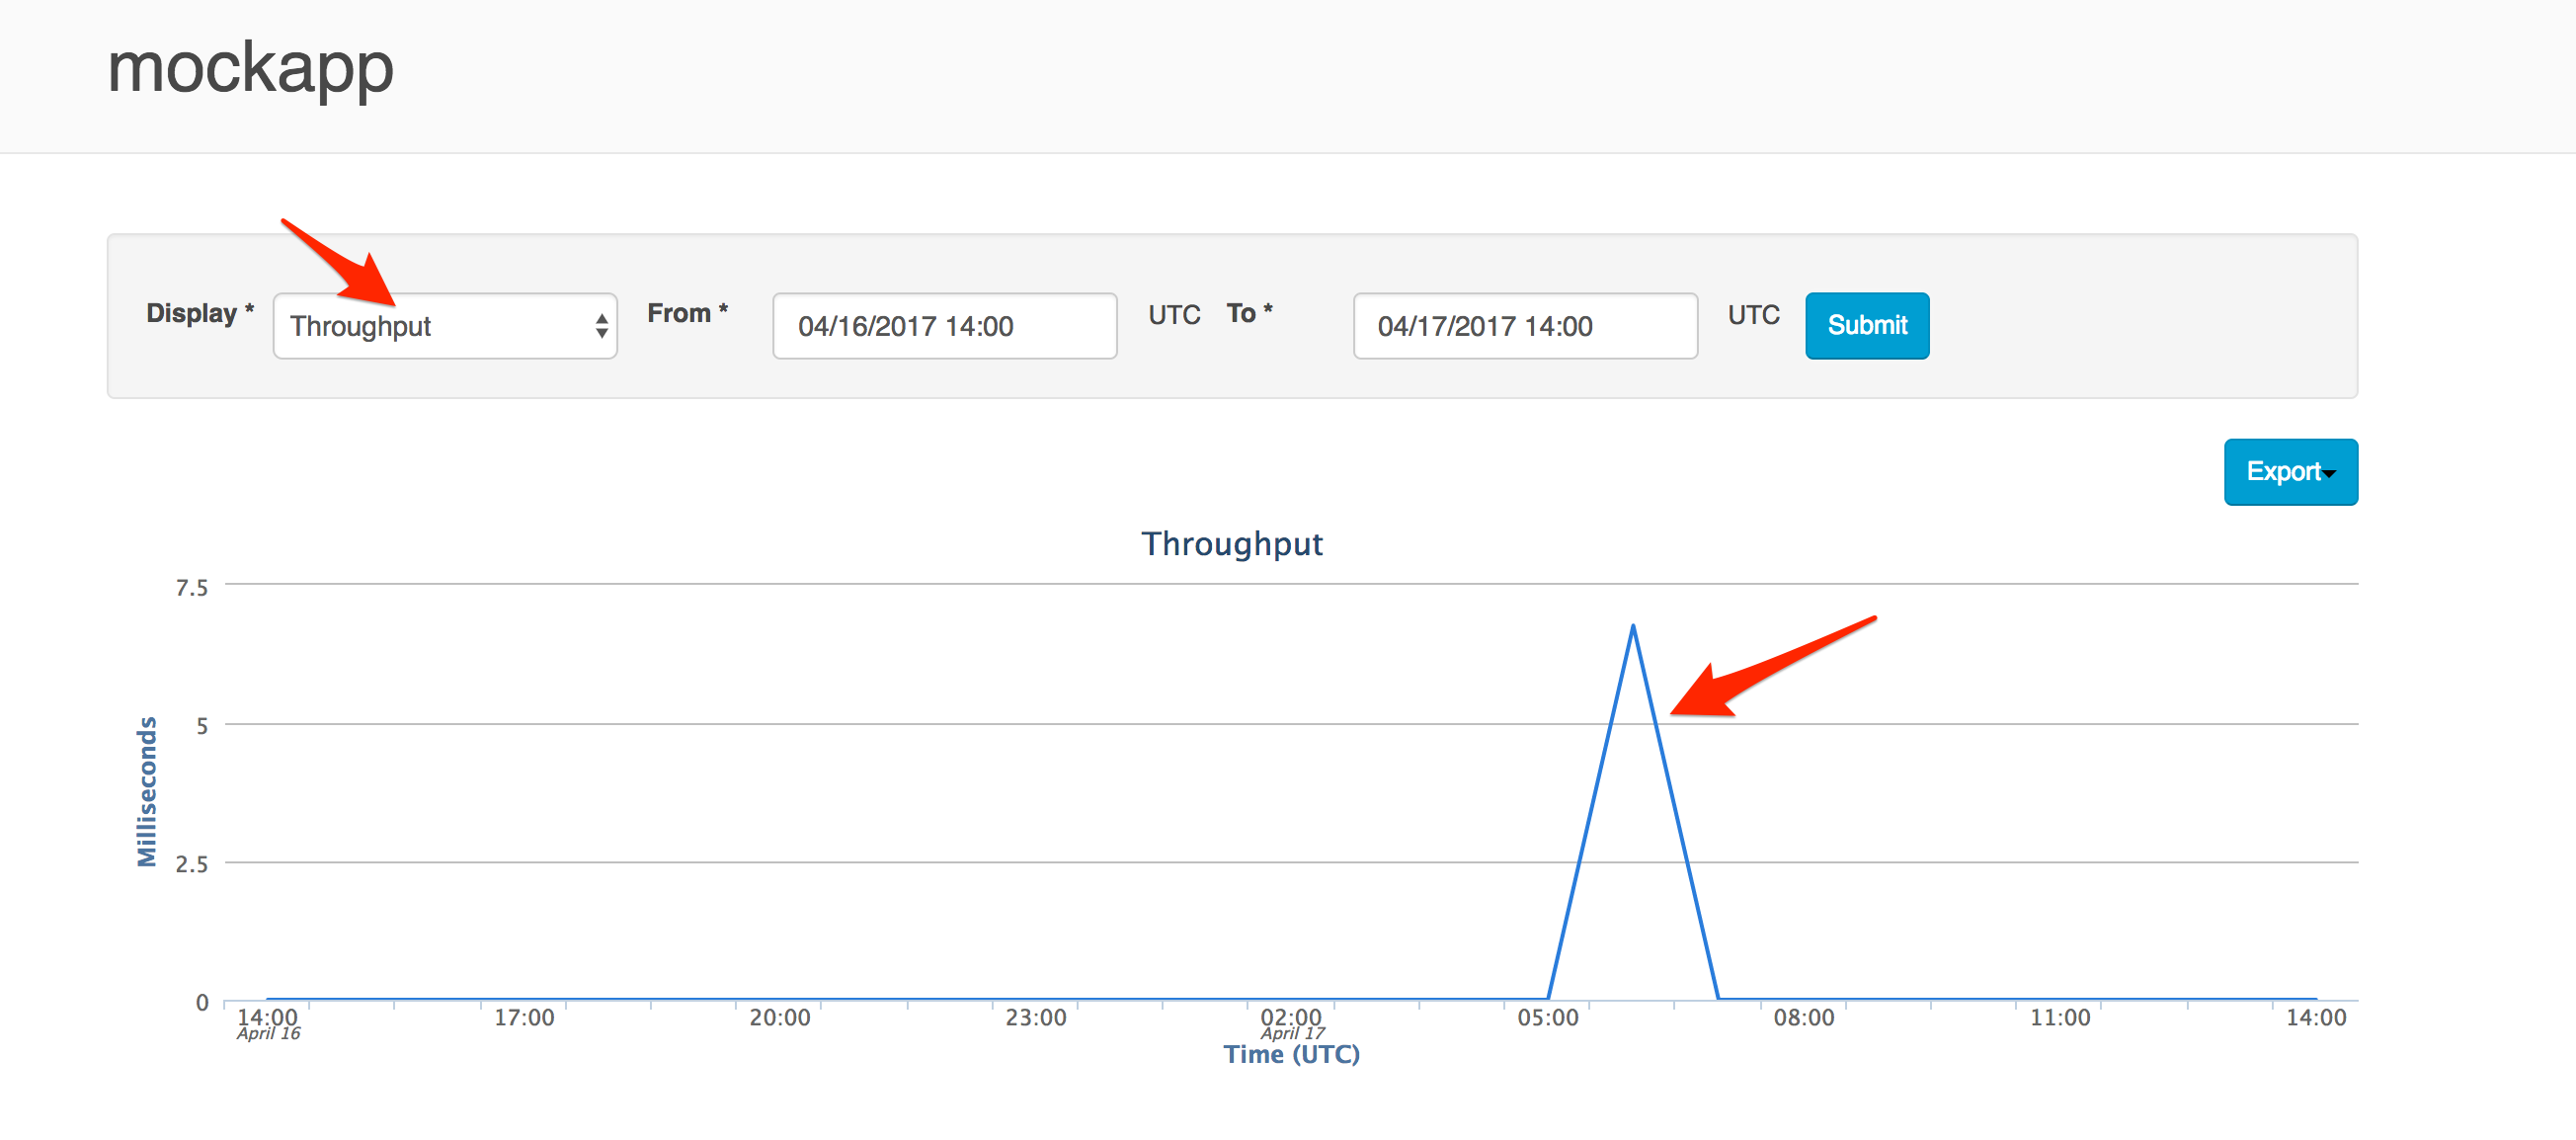
If you are using Developer Portal, You might have seen App Analytics page that looks like below out of the box.

It's less intuitive when it comes to viewing different analytics using out of the box form & select box. I feel, A dashboard like UI similar to edge analytics will definitely help in improving the user experience. I have a built a custom module that showcases how you can extend out of the box analytics dashboard in Apigee Developer Portal & Improve the UX using highcharts.
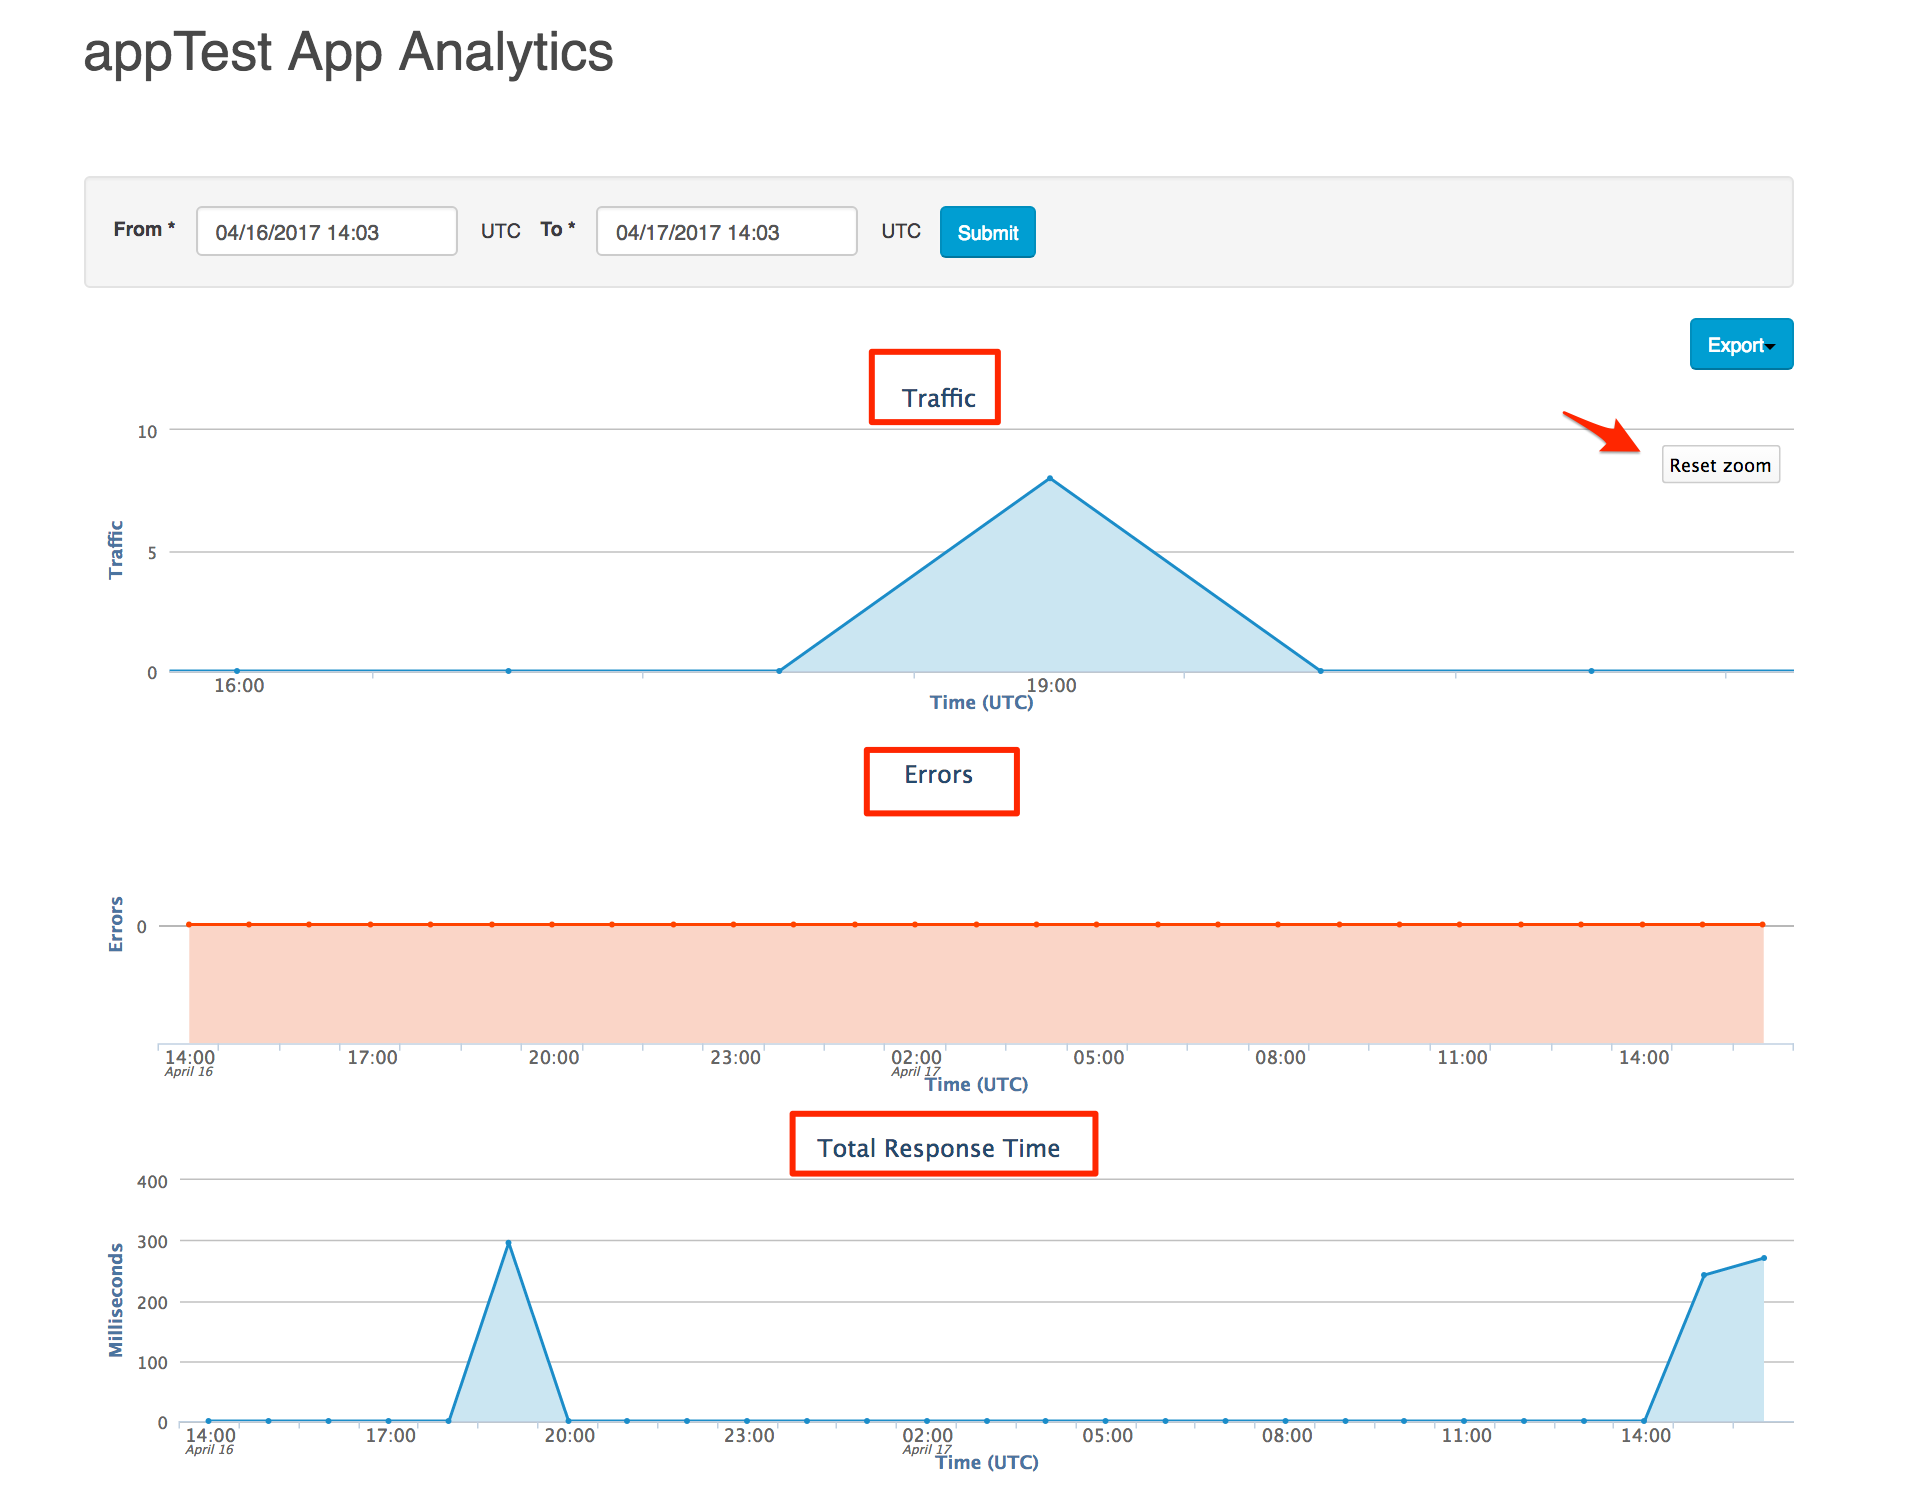
Few improvements which i thought will help App Developer Experience,
- Looks & Feel similar to Apigee Edge Analytics Dashboard
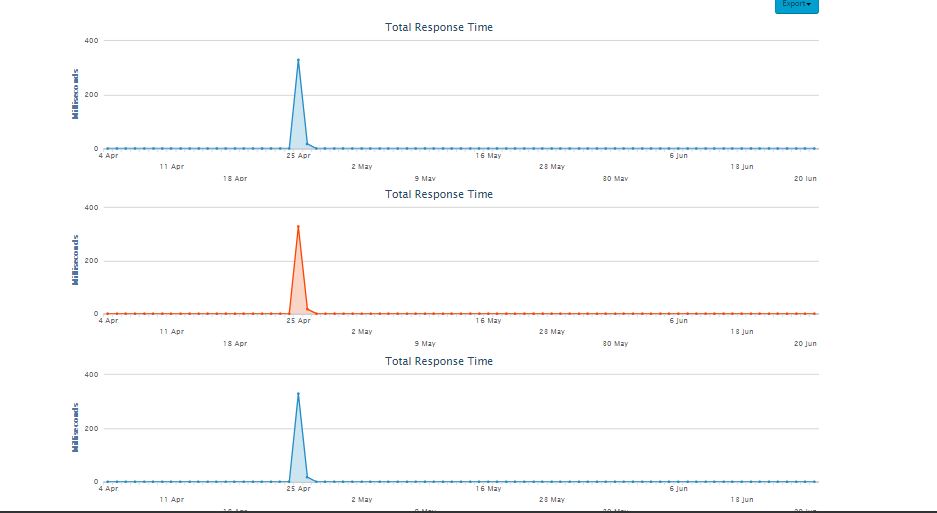
- Ability to zoom in the time line
- Dashboard like view with different widgets like Traffic, Errors, Total Response time
- Simple UI with Ability to select historic dates.

You can find the module source code here, https://github.com/anil614sagar/apigee-devportal-analytics-ui
Installation Instructions :
- Download above repository code
- Copy folder "apigee_developer_app_analytics" into "sites/all/modules/custom"
- Enable the module from "admin/modules" page in Developer Portal as administrator.
Please feel free to share your feedback / queries using comments below.
Topic Labels
Comments
snitin2
New Member
- Mark as Read
- Mark as New
- Bookmark
- Permalink
- Report Inappropriate Content
06-21-2017
12:33 AM

snitin2
New Member
- Mark as Read
- Mark as New
- Bookmark
- Permalink
- Report Inappropriate Content
06-22-2017
06:15 AM
how to add new graph like Transaction per secound(tps) in php code shared?
anvimalia
New Member
- Mark as Read
- Mark as New
- Bookmark
- Permalink
- Report Inappropriate Content
06-23-2017
01:57 PM
Hi i tried this but i see nothing.. it's just blank
anilsr
Staff
- Mark as Read
- Mark as New
- Bookmark
- Permalink
- Report Inappropriate Content
06-27-2017
10:36 PM
Above issue with missing Traffic and Errors graphs when you pick data has been fixed. Please take updated code from here.
Hope it helps.
anilsr
Staff
- Mark as Read
- Mark as New
- Bookmark
- Permalink
- Report Inappropriate Content
06-27-2017
10:56 PM
@Nitin_983650 , Need some custom coding & extending the Apigee Management PHP SDK, Little bit of Drupal Expertise to achieve what you are looking for.
Some pointers, see .module code in above github. Also, You need to make sure it doesn't raise invalid metric error from SDK. profiles/apigee/libraries/mgmt-api-php-sdk/Apigee/ManagementAPI/DeveloperAppAnalytics.php - getMetrics function. You need to override above getMetrics in custom module.
anilsr
Staff
- Mark as Read
- Mark as New
- Bookmark
- Permalink
- Report Inappropriate Content
06-27-2017
11:19 PM
@Anvi , It should work, I have just tested. Make sure the env matches with traffic in App Setting screen & You got the traffic for app.
anvimalia
New Member
- Mark as Read
- Mark as New
- Bookmark
- Permalink
- Report Inappropriate Content
06-30-2017
01:59 PM
Hi @Anil Sagar
I checked the logs... this is what I see
Notice: Undefined variable: tabs in _devconnect_developer_app_analytics_detail() (line 78 of /var/www/html/sites/all/modules/custom/apigee_developer_app_analytics/apigee_developer_app_analytics.module).
any ideas?