- Google Cloud
- Articles & Information
- Cloud Product Articles
- Apigee Hybrid Cassandra Monitoring
- Subscribe to RSS Feed
- Mark as New
- Mark as Read
- Bookmark
- Subscribe
- Printer Friendly Page
- Report Inappropriate Content
- Article History
- Subscribe to RSS Feed
- Mark as New
- Mark as Read
- Bookmark
- Subscribe
- Printer Friendly Page
- Report Inappropriate Content
Apache Cassandra is the runtime datastore that provides data persistence for the Apigee Hybrid runtime plane, providing storage for entities such as
- Key Management System (KMS)
- Key Value Map (KVM)
- OAuth
- Management API for RunTime data (MART)
- Monetization data
- Quotas
- Caches
As a critical component for the Apigee Runtime plane to process API requests, it's important to ensure Cassandra is operating as expected via monitoring and alerting.
Monitoring
Using Cloud Monitoring, there are Cassandra metrics available that can be used to create dashboards. These are a suggested set of metrics and aggregations for monitoring
- Cassandra read request rate
- apigee.googleapis.com/cassandra/clientrequest_latency
- metric.scope: 'Read'
- metric.unit: 'OneMinuteRate'
- Cassandra write request rate
- apigee.googleapis.com/cassandra/clientrequest_latency
- Metric.scope: Write
- metric.unit:'OneMinuteRate'
- Cassandra read request latency
- apigee.googleapis.com/cassandra/clientrequest_latency
- metric.scope: 'Read'
- metric.unit: '99thPercentile', '95thPercentile', '75thPercentile'
- Cassandra write request latency
- apigee.googleapis.com/cassandra/clientrequest_latency
- metric.scope: 'Write'
- metric.unit: '99thPercentile', '95thPercentile', '75thPercentile'
- Cassandra pod CPU request utilization
- kubernetes.io/container/cpu/request_utilization
- Cassandra data volume utilization
- kubernetes.io/pod/volume/utilization
To add multiple metric unit aggregations (99/95/75th percentile), these can be added as separate time series to the same chart. Cloud Monitoring also has out of the box grouping for 99/95/50th percentile that can be used in place of metric.unit.
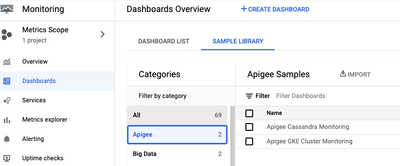
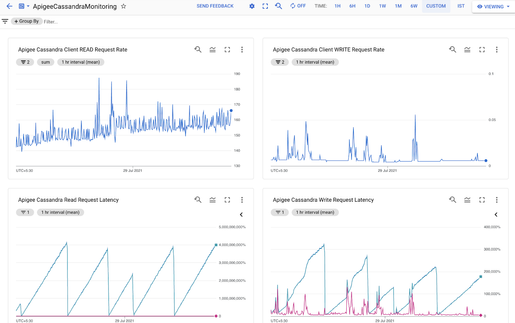
A preconfigured sample dashboard is also available within the Google Cloud Console's Cloud Monitoring Sample dashboards.

Cloud Monitoring Apigee Sample Dashboards

Apigee Cassandra Monitoring Sample Dashboard
Alerting
Cloud Monitoring can be used to define alerts to bring issues to the attention of your operations team. See below as a starting guide to defining alerts on Cassandra. This can then be adjusted over time to adjust for false alarms or increased sensitivity based on your installation and requirements.
If you observe read or write request latency trending upwards continuously, and there is a corresponding CPU request utilization spike along with spikes in read or write request rate, this is indicating your cassandra cluster is under stress and you should consider scaling up.
|
Alert name |
Threshold |
Trigger |
Description |
|
Cassandra Data Volume Utilization above 85% Metric: kubernetes.io/pod/volume/utilization |
Above 85% |
5 min |
Cassandra data volume utilization is more than 85% |
|
Cassandra Pod CPU Request Utilization above 85% Metric: kubernetes.io/container/cpu/request_utilization |
Above 85% |
3 min |
Cassandra pod CPU request utilization is more than 85% |
|
Cassandra read request latency at 95thPercentile Metric: apigee.googleapis.com/cassandra/clientrequest_latency Metric.scope: 'Read' Metric.unit: '95thPercentile' |
5 seconds |
3 min |
Average read request latency in the 95th percentile range in microseconds for Apigee Cassandra. |
|
Cassandra write request latency at 95thPercentile Metric: apigee.googleapis.com/cassandra/clientrequest_latency Metric.scope: 'Write' metric.unit: '95thPercentile' |
5 seconds |
3 min |
Average write request latency in the 95th percentile range in microseconds for Apigee Cassandra. |
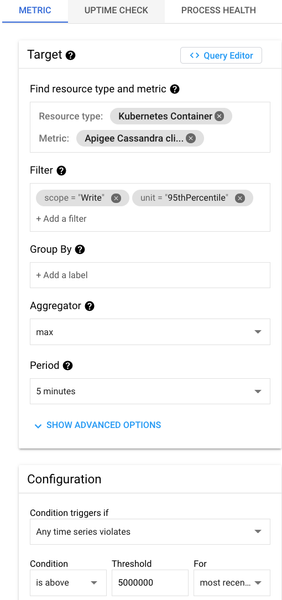
Note that the Cassandra Latency metrics are in microseconds, eg 5 seconds = 5000000 and can be used with the max aggregator

Example Cassandra Write Latency Alert
- Mark as Read
- Mark as New
- Bookmark
- Permalink
- Report Inappropriate Content
Thanks for detailed write up.
1. Above metrics is applicable to which apigee hybrid and Cassandra version ?
Or if we have any latest on the above details ?
2. Do we have any details on monitoring listed performance metrics for apigee hybrid Cassandra ?
- Disk usage
- Hints
- Java managed memory
- Load
- Thread Pools

 Twitter