- Google Cloud
- Cloud Forums
- Apigee
- Correlated Logging: Configuring End-to-End Distrib...
- Subscribe to RSS Feed
- Mark Topic as New
- Mark Topic as Read
- Float this Topic for Current User
- Bookmark
- Subscribe
- Mute
- Printer Friendly Page
- Mark as New
- Bookmark
- Subscribe
- Mute
- Subscribe to RSS Feed
- Permalink
- Report Inappropriate Content
- Mark as New
- Bookmark
- Subscribe
- Mute
- Subscribe to RSS Feed
- Permalink
- Report Inappropriate Content
Overview
These days, majority of organizations have complex software architectures and host applications that span across multi/hybrid cloud environments. Imagine that your applications, regardless of whether they are implemented using microservices or monolithic architecture, are fronted by components like proxies, load balancers, network bridges, or API Management platforms like Apigee, and interact with some downstream systems (say, some more applications or datastores). In case any of your applications suffer from failures or exhibit degraded performance, given the complexity of the software architecture, it could be really hard to pinpoint the root cause.
In such situations, when end-to-end monitoring of critical applications and flows is required, Distributed Tracing comes to the rescue.
This article focuses on configuring Distributed Tracing for Apigee using Cloud Trace.
Distributed Tracing
As briefly touched upon in the Overview section above, Distributed Tracing is a method used to monitor and profile applications. For the SRE, DevOps, and IT teams at your organization, it could serve as a Swiss Army Knife for debugging and monitoring purposes.
Distributed Tracing, also called Distributed Request Tracing, helps get visibility into the operations of a distributed software system. One could understand exactly what a particular service is doing as part of the whole transaction. Reports showing time taken by a request at each step of the entire flow could be generated and one could even perform more granular analysis through the associated metadata getting exposed. In a nutshell, Distributed Tracing provides insights, through its diagnostic capabilities, into what happens across service boundaries and how different services coordinate to handle requests.
Important Terminologies
Before understanding how Distributed Tracing can be configured, some important terms and concepts need to be understood.
Trace
A trace represents the end-to-end execution path/flow of a request/transaction as it is processed through different systems/applications. The data collection process for a request/transaction starts the moment the request/transaction is initiated. Each trace is generally composed of multiple units known as spans.
Span
A span represents, in a trace, a single unit of work that is performed by a service; it is essentially the span of time a service takes to perform some work. For example, an API call to a downstream service would result in producing a span. Each service in the execution chain/path of a specific request/transaction contributes a span that is identified by a named and timed operation; each span gets a unique span ID. Spans can be annotated with metadata (also known as attributes or tags) and events (also known as logs). The span metadata helps contextualize a span.
Spans can be considered as building blocks of a trace.
When the data collection process starts for a request/transaction (considering Distributed Tracing is enabled), a unique trace identifier (trace ID) is generated and an initial (first) span called the Root/Parent Span is created. All the subsequent/following work units (sub-operations of a transaction) are captured in Child Spans. Each child span can further be composed of more child spans (in case a service has a lot of commands, operations, or queries to trigger), resulting in Nested Spans.
Finally, all the spans corresponding to a particular trace can be visualized (generally through a Flame Graph), with each span representing the time taken and metadata associated with the respective operation.
Trace Context
Trace Context helps identify a trace and each individual span within it with the help of trace ID, span ID(s), and related metadata. The Trace Context is required to ensure Context Propagation which helps in passing context information from one transaction to the next (here the meaning of transaction is the operation which is happening at each service level, as part of the main request/transaction). This also helps in capturing the causal relationship between different operations in a request/transaction. The Trace Context is added to the metadata of the used transport protocol, for example, Trace Context can be added as an HTTP Header, MQTT user property, etc.
Distributed Tracing for Apigee
Now that we have a sound understanding of foundational Distributed Tracing concepts, we are good to discuss Distributed Tracing with regards to Apigee.
Apigee offers a Debug Tool (used to be known as Trace Tool in older flavours of Apigee) to create and manage debug sessions, which can be quite useful for troubleshooting and monitoring API Proxies. The Debug Tool also helps in viewing details of Apigee Flow Variables, step-by-step policy execution, etc. However, the Debug Tool is not suitable for tracking intermittent or unpredictable events/errors as the data corresponding to a Debug Session is deleted within 24 hours of the Debug Session getting completed and also the Debug Tool does not send any data to Distributed Tracing servers like Cloud Trace.
To tackle this problem, Apigee allows users to explicitly enable the Distributed Tracing feature for their Apigee Runtime(s). Once Distributed Tracing is enabled, the Apigee Runtime(s) can send trace data to the target Distributed Tracing server(s).
Distributed Tracing Reports for Apigee
The following information is made available in the Distributed Tracing Reports for Apigee:
- Execution time of an entire flow.
- Time at which the request is received by Apigee.
- Time at which the request is sent to the target backend.
- Time at which the response is received from the target backend.
- Execution time of each API Proxy Policy in a flow.
- Execution time of Service Callouts and Target Flows.
- Time at which the response is sent to the client.
As covered earlier above, the execution details of the request flows are available in the form of spans of a trace.
Following individual spans (nested as shown) are available for each trace:
- Request
- Proxy
- Preflow
- Postflow
- Target
- Preflow
- Postflow
- Response
- Proxy
- Preflow
- Postflow
- Target
- Preflow
- Postflow
More information on the data that is exposed in a standard Tracing Report can be found at the official Apigee Distributed Tracing documentation. The data exposed as part of the Tracing Report can be supplemented (custom information can be captured as part of the traces) using TraceCapture Policy.
Supported Distributed Tracing Systems/Platforms
Apigee Runtime supports the following Distributed Tracing Systems/Platforms:
Both Apigee X and Apigee Hybrid Runtimes support Distributed Tracing using Cloud Trace.
As part of this article, Distributed Tracing for Apigee X using Cloud Trace will be explored.
Configuring Distributed Tracing for Apigee using Cloud Trace
Pre-requisites
- An up and running Apigee X Organization with at least one Apigee Environment and a handful of API Proxies deployed, accessible through a hostname.
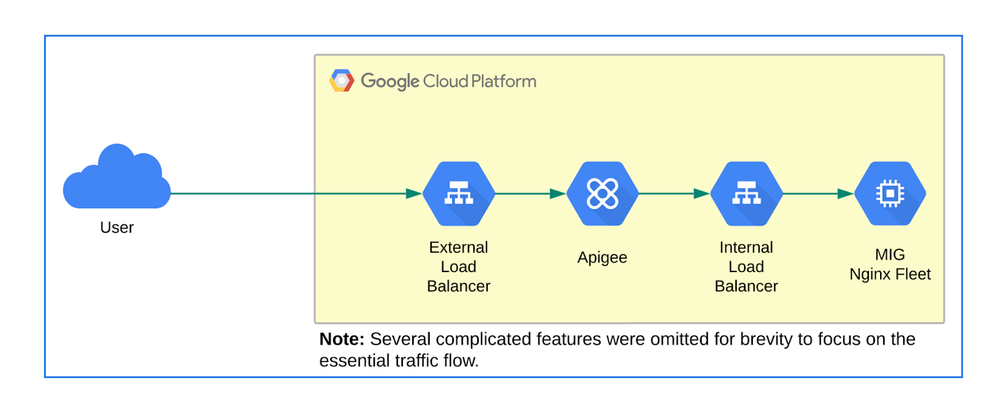
- This article highlights a use-case where Apigee X is fronted by an External Load Balancer and has a MIG (running Nginx servers and fronted by an Internal Load Balancer) as the target backend. This implementation should be treated as a reference setup only. A similar setup is expected in your (reader’s) GCP environment if you want to fully follow along, however, not all components need to be identical as shown in this article.
Diagram: High-level Architecture for End-to-End Transaction Tracking Experiment
Configuration Steps
Step 1: Enable Trace API
In order to use Cloud Trace with Apigee X, the Google Cloud Project associated with Apigee must have the Cloud Trace API enabled. This enables the Google Cloud Project with Apigee to receive trace data from the authenticated sources.
Cloud Trace API can be enabled using the below-mentioned commands:
# Export PROJECT_ID as an environment variable.

PROJECT_ID=<YOUR_GOOGLE_CLOUD_PROJECT_ID>


# Set the gcloud configuration to point to the desired GCP Project ID.

gcloud config set project $PROJECT_ID


# Enable the "cloudtrace.googleapis.com" API.

gcloud services enable cloudtrace.googleapis.com
Step 2: Enable Distributed Tracing using Apigee/Management API
Before triggering the Apigee/Management API, export the below-mentioned environment variables:
# Defines the Authorization Bearer Token for making the Apigee/Management API Call.

TOKEN="Authorization: Bearer $(gcloud auth print-access-token)"


# Apigee Environment Name for which Distributed Tracing needs to be enabled.

ENV_NAME=<YOUR_APIGEE_ENVIRONMENT_NAME>
Execute the Apigee/Management API call as shown below:
curl -H "$TOKEN" \

    -H "Content-Type: application/json" \

    https://apigee.googleapis.com/v1/organizations/$PROJECT_ID/environments/$ENV_NAME/traceConfig \

    -X PATCH \

    -d '{"exporter":"CLOUD_TRACE","endpoint": "'"$PROJECT_ID"'",

    "samplingConfig": {"sampler": "PROBABILITY","samplingRate": 0.1}}'
Notes:
- The samplingRate can be, at max, configured to 0.5 i.e. approximately 50% of the API calls will be tracked by the Distributed Tracing System/Platform. This is a product limit as tracing all the API calls would impact performance. For more information, check out the Performance Considerations for Distributed Tracing for Apigee.
- The Distributed Tracing setting is applied at an Apigee Environment level. The settings can be overridden at an API Proxy level, as stated at the official documentation.
If you already have Distributed Tracing enabled for your Apigee Runtime, you can even view the existing Distributed Tracing configuration by following the process stated at the official documentation.
Step 3: Enable Logging for the External Load Balancer
As per our high-level architecture, as shown above, an External Load Balancer fronts Apigee. In order to have end-to-end Distributed Tracing enabled, logging at the External Load Balancer level is necessary. Logging can be enabled for the External Load Balancer, regardless of whether it uses PSC NEG or MIG backend for reaching Apigee, by configuring logging settings at the backend service which is used to route traffic to Apigee. When logging for the External Load Balancer is enabled, tracing information would start populating in Cloud Trace.
Follow the procedure as stated at the official documentation to enable logging for the backend service associated with External Load Balancer. Don’t forget to set the appropriate sampling rate.
Step 4: Enable Logging for the Internal Load Balancer
As per our high-level architecture, as shown above, Apigee is hitting an Internal Load Balancer (fronting a MIG running Nginx servers) as the target backend. In order to have end-to-end Distributed Tracing enabled, logging at the Internal Load Balancer level (similar to the External Load Balancer, logging configuration needs to be applied at the backend service) is necessary. When logging for the Internal Load Balancer is enabled, tracing information would start populating in Cloud Trace.
Follow the procedure as stated at the official documentation to enable logging for the backend service associated with Internal Load Balancer. Don’t forget to set the appropriate sampling rate.
Step 5: Configure Custom Message Logging for API Proxy
Message Logging can be used to log the trace identifier details corresponding to a transaction at the Apigee level, as shown below.
<?xml version="1.0" encoding="UTF-8" standalone="yes"?>

<MessageLogging continueOnError="false" enabled="true" name="EXT-ML-TracingInformation">

    <DisplayName>EXT-ML-TracingInformation</DisplayName>

    <CloudLogging>

        <LogName>projects/{organization.name}/logs/apigeeTracingLogs</LogName>

        <Message contentType="application/json">{"requestPayload": "{request.header.Traceparent}"}</Message>

        <ResourceType>gce_instance</ResourceType>

    </CloudLogging>

</MessageLogging>
Notes:
- Traceparent header is getting logged essentially. Traceparent is a standard HTTP header which carries the Trace Context and helps with Context Propagation. There are some other headers (Zipkin B3 headers) also present which capture the trace id but Traceparent, being a standard header, is the preferred one.
- This Message Logging Policy can even be made part of a Shared Flow that gets executed using some Flow Hook.
- A Service Account with Logs Writer IAM permissions will be needed to deploy the Shared Flow / API Proxy containing the Message Logging Policy.
Step 6: Configure Logging of Custom Traceparent Header at Nginx level
This is a totally optional step and configuration depends on the underlying server/application. For this demonstration, the configuration for logging the Traceparent header was done at the nginx.conf level (details not included in this article but proxy_set_header configuration can be used followed by tuning the log_format for Nginx).
Viewing the Traces
Step 1: Hit API Proxy(ies)
Hit the desired API Proxy in order to generate some traffic.
Step 2: The Cloud Trace View
- Go to Google Cloud Console and navigate to Trace.
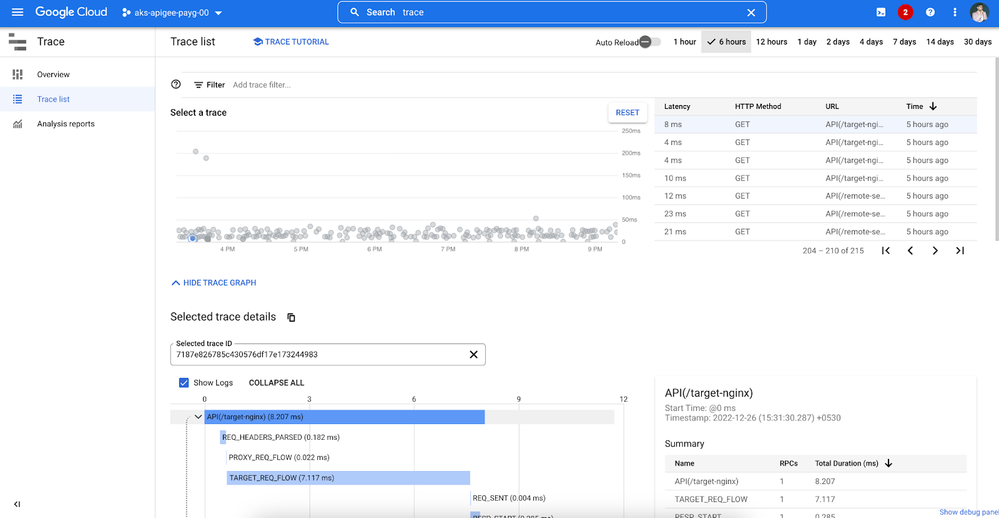
- The Trace service will show Trace List with some visualization for the selected time frame, as shown below.
Diagram: Trace List View
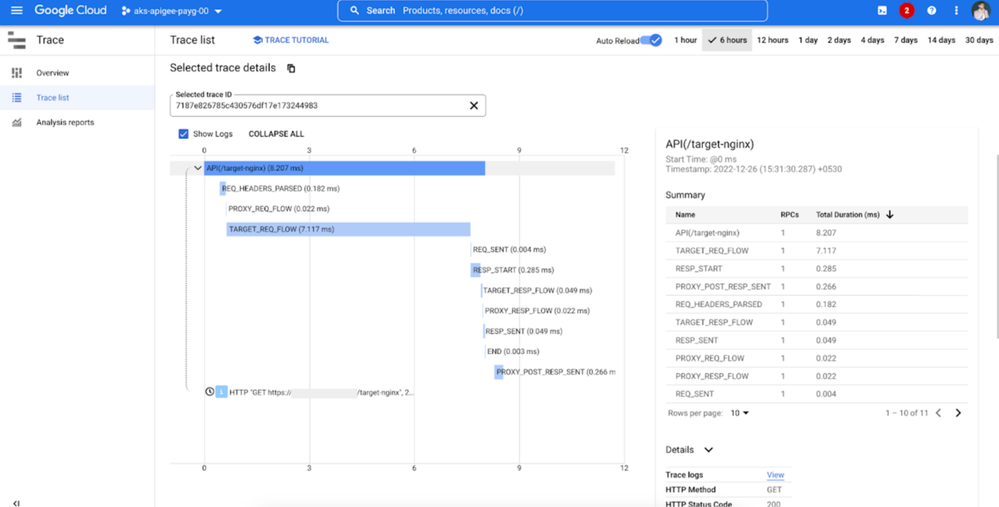
- Select a trace record from the list and the corresponding trace details would show up on the console. Feel free to study all the fields and data by expanding spans and sub-sections of the trace.
Diagram: Trace Details
Step 3: Enable Show Logs Option in the Trace Console
Make sure to have the Show Logs checkbox ticked under the trace section to get a link to the External Load Balancer logs corresponding to the trace. Note the trace ID here which is even searchable in the Logs Explorer, which forms part of the Traceparent header.
Step 4: View Trace Logs in the Logs Explorer
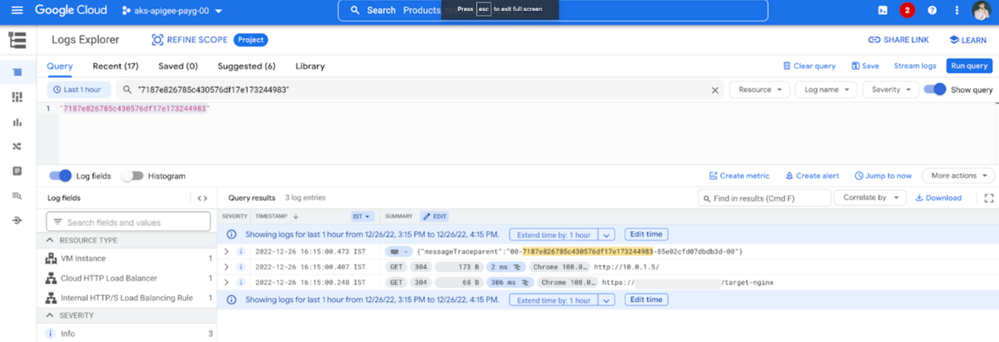
Navigate to the Logs Explorer from the View Logs button on the trace console or open Logs Explorer in a separate window and search for the trace id.
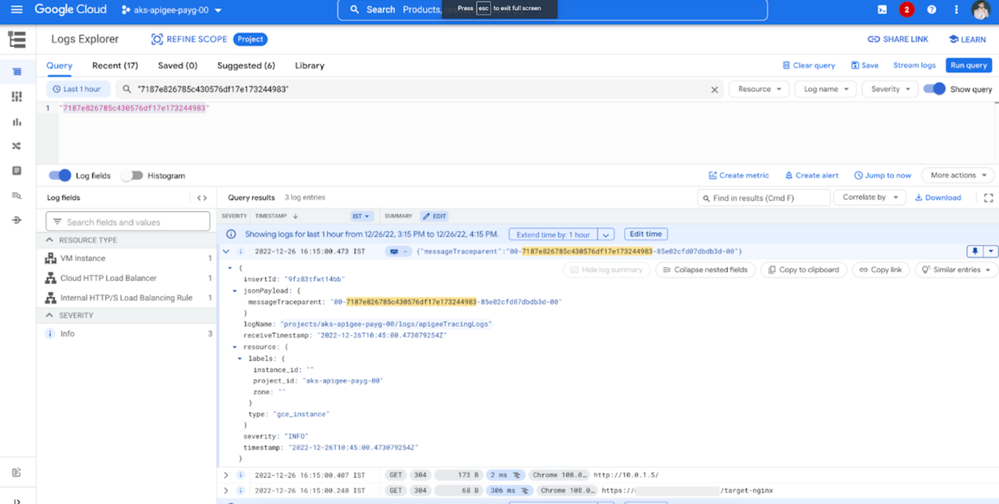
Diagram: Logs Explorer with Trace ID as the Search String
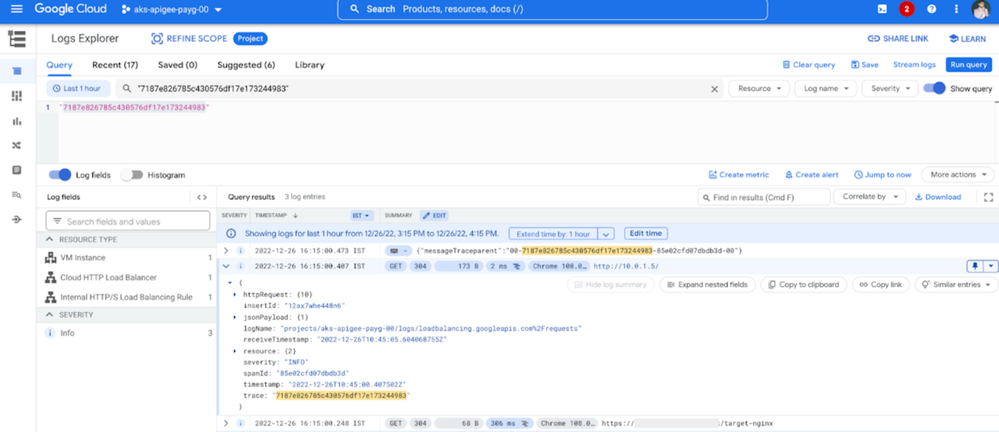
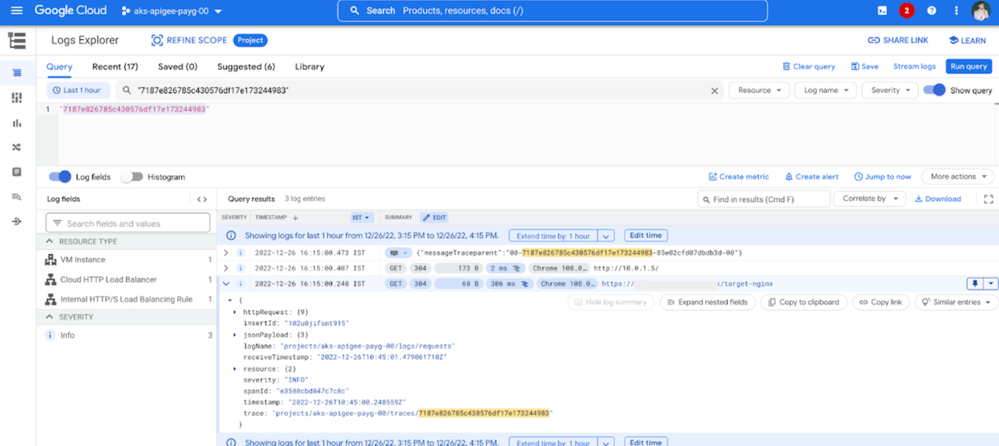
Now feel free to expand the details and see logs for External Load Balancer (third record in the screenshot above), Internal Load Balancer (second record in the screenshot above), Apigee API Proxy Message Log (first record in the screenshot above).
Diagram: Apigee Message Logging Policy Log
Diagram: Internal Load Balancer Log
Diagram: External Load Balancer Log
Step 5: View Trace Logs in the Nginx Server
The application logs (Nginx here) can log the Traceparent header and the same can be shipped to Logs Explorer using the Ops Agent.
Diagram: Application Logs with Traceparent Header
Further Reading
If you are interested in further exploring the space of Distributed Tracing for Apigee (including Apigee Hybrid) or if you are interested in sending the trace information to third-party Distributed Tracing Systems/Platforms, check out some amazing blog posts by my esteemed colleague @ncardace on Distributed Tracing for Apigee with Dynatrace and New Relic.
- Labels:
-
API Runtime
-
Apigee General
-
Apigee X
-
Hybrid
- Mark as New
- Bookmark
- Subscribe
- Mute
- Subscribe to RSS Feed
- Permalink
- Report Inappropriate Content
- Mark as New
- Bookmark
- Subscribe
- Mute
- Subscribe to RSS Feed
- Permalink
- Report Inappropriate Content
Great article, glad you also included GLB, ILB, MIGs in trace!
- Mark as New
- Bookmark
- Subscribe
- Mute
- Subscribe to RSS Feed
- Permalink
- Report Inappropriate Content
- Mark as New
- Bookmark
- Subscribe
- Mute
- Subscribe to RSS Feed
- Permalink
- Report Inappropriate Content
Thanks, @helloayush 🙂
- Mark as New
- Bookmark
- Subscribe
- Mute
- Subscribe to RSS Feed
- Permalink
- Report Inappropriate Content
- Mark as New
- Bookmark
- Subscribe
- Mute
- Subscribe to RSS Feed
- Permalink
- Report Inappropriate Content
Hi,
Thanks for your post. I have a question : when I call Apigee from a frontend, I already send a header traceparent but in Trace explorer it's not the same trace ID.
If I use Debug, I can see that Apigee generate new trace ID in x-b3-traceid header, and this is the trace in Trace explorer and not my original traceid ...
How can I use the original traceparent (from the consumer) in Trace explorer ?
Regards
-
Analytics
497 -
API Hub
75 -
API Runtime
11,665 -
API Security
178 -
Apigee General
3,041 -
Apigee X
1,287 -
Developer Portal
1,910 -
Drupal Portal
43 -
Hybrid
463 -
Integrated Developer Portal
89 -
Integration
310 -
PAYG
13 -
Private Cloud Deployment
1,068 -
User Interface
77

 Twitter